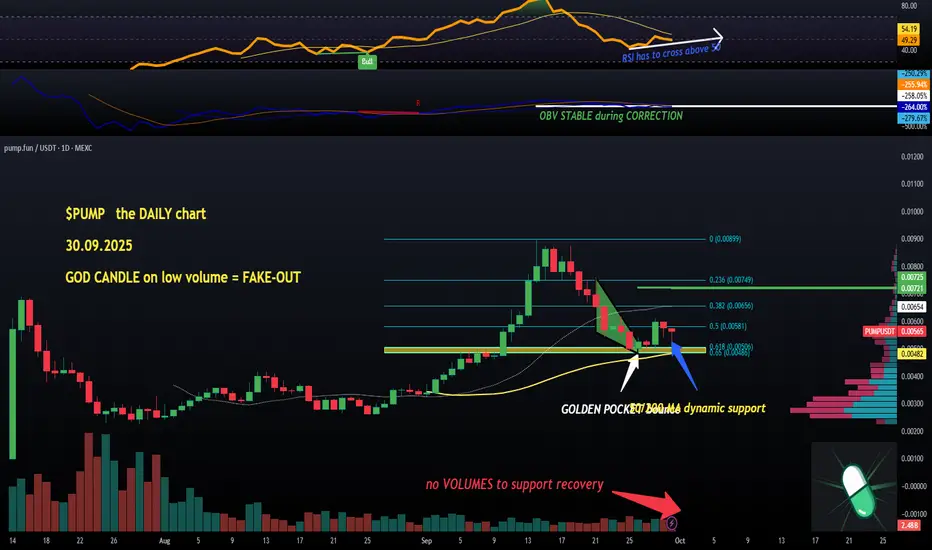
And it turned out to be a fake-out which trapped many bulls around 0.6c.
So now, looking at the heatmap (last month's bit) there is a lot of reasons to drop further and even as low as mid-3cents.
Or #pump it to 0.9c.
Time will tell and more details on shorter timeframes in terms of a possible reversal to the upside, but the DAILY is still missing rising volume candles but I am expecting this to change as soon as the 6c mark is established as support.
With volumes, again, as we need to see real buyers coming back in, the OBV is showing flat action during the recent correction which is a positive.
4-hour chart next.
💙👽
Aviso legal
As informações e publicações não devem ser e não constituem conselhos ou recomendações financeiras, de investimento, de negociação ou de qualquer outro tipo, fornecidas ou endossadas pela TradingView. Leia mais em Termos de uso.
Aviso legal
As informações e publicações não devem ser e não constituem conselhos ou recomendações financeiras, de investimento, de negociação ou de qualquer outro tipo, fornecidas ou endossadas pela TradingView. Leia mais em Termos de uso.