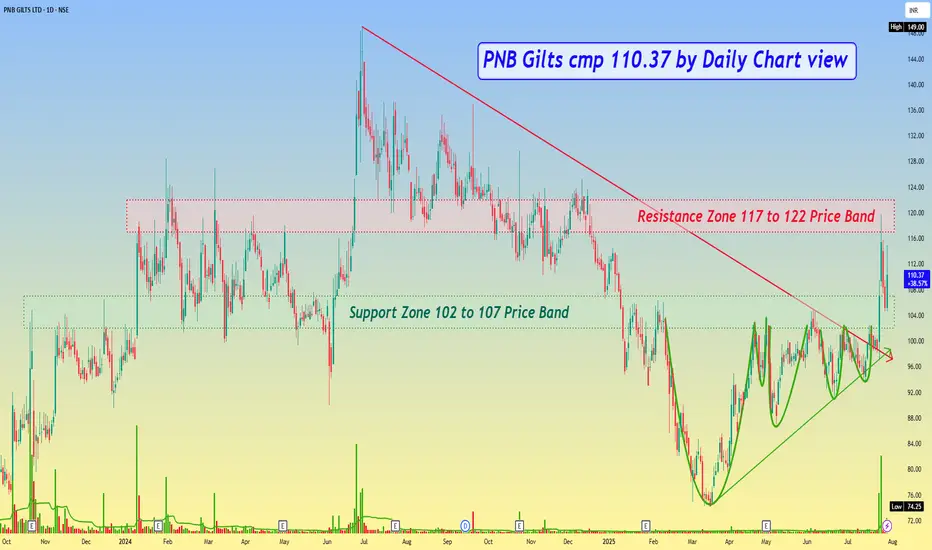
PNB Gilts cmp 110.37 by Daily Chart view
- Support Zone 102 to 107 Price Band
- Resistance Zone 117 to 122 Price Band
- Volumes are seen spiking heavily over past few days
- Support Zone is getting tested retested since last week
- Bullish Technical Chart indicates decent breakout probability
- Falling Resistance Trendline Breakout is seen to be well sustained
- Very closely considerate VCP pattern has formed below the Support Zone
- Majority Technical Indicators BB, EMA, SAR, MACD, RSI, SuperTrend trending positively
Aviso legal
As informações e publicações não se destinam a ser, e não constituem, conselhos ou recomendações financeiras, de investimento, comerciais ou de outro tipo fornecidos ou endossados pela TradingView. Leia mais nos Termos de Uso.
Aviso legal
As informações e publicações não se destinam a ser, e não constituem, conselhos ou recomendações financeiras, de investimento, comerciais ou de outro tipo fornecidos ou endossados pela TradingView. Leia mais nos Termos de Uso.