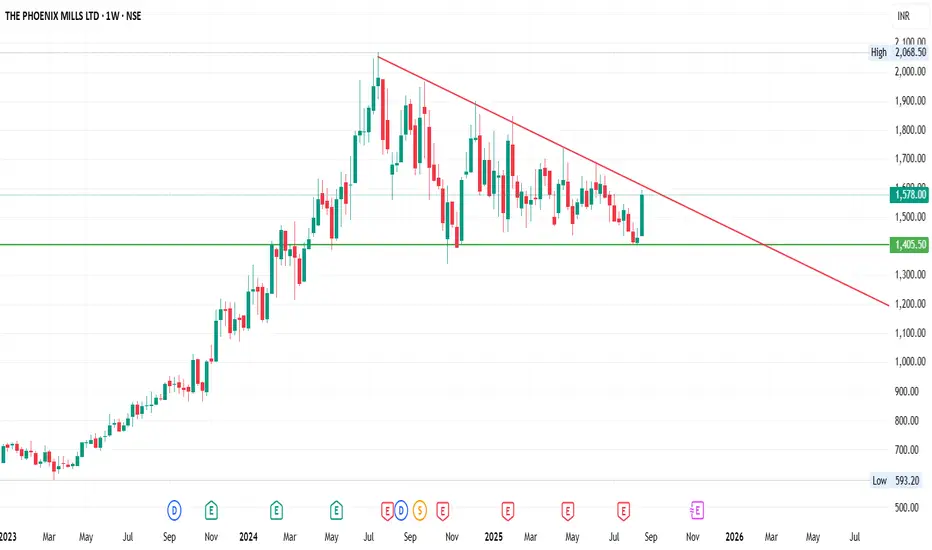
Chart Pattern: On the weekly chart, Phoenix Ltd. is forming a triangle consolidation pattern after a strong prior uptrend.
Technical View
Support Zone: ₹1400 (strong base, tested multiple times).
Resistance Trendline: Descending resistance capping the upside.
Volume: Watch for a surge in volume to confirm breakout direction.
Breakout Levels:
What do you think? Will Phoenix Ltd. break upwards or downwards? Drop your views below!
Disclaimer: This analysis is for educational purposes only, not financial advice. Please do your own research before investing.
- The descending trendline (red) is acting as resistance.
- A strong horizontal support zone near ₹1400 (green) has been tested multiple times, showing buyers’ interest at this level.
- Price action is currently squeezing inside the triangle, indicating that a big breakout move may be near.
Technical View
Support Zone: ₹1400 (strong base, tested multiple times).
Resistance Trendline: Descending resistance capping the upside.
Volume: Watch for a surge in volume to confirm breakout direction.
Breakout Levels:
- Bullish breakout above the descending trendline could open up targets towards ₹1600–₹1700.
- Be
What do you think? Will Phoenix Ltd. break upwards or downwards? Drop your views below!
Disclaimer: This analysis is for educational purposes only, not financial advice. Please do your own research before investing.
Aviso legal
As informações e publicações não se destinam a ser, e não constituem, conselhos ou recomendações financeiras, de investimento, comerciais ou de outro tipo fornecidos ou endossados pela TradingView. Leia mais nos Termos de Uso.
Aviso legal
As informações e publicações não se destinam a ser, e não constituem, conselhos ou recomendações financeiras, de investimento, comerciais ou de outro tipo fornecidos ou endossados pela TradingView. Leia mais nos Termos de Uso.