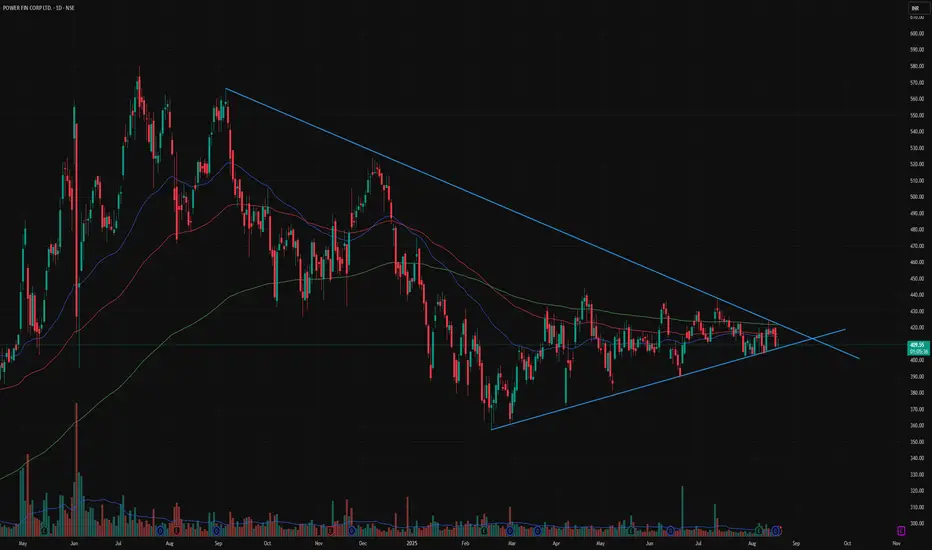
📊 Stock: Power Finance Corporation (PFC)
🔹 Symmetrical triangle pattern forming – price squeezing into apex
🔹 Long consolidation with volume stability – accumulation signs visible
🔹 Holding support near rising trendline (₹405–410)
🔹 Facing resistance near falling trendline (₹425–430)
🔹 Trading around 50, 100 & 200 DMA cluster – decisive move expected
🔹 RSI hovering near neutral – waiting for direction
🔹 Fundamentally strong PSU with consistent dividend payouts
⚡ Price tightening near breakout zone (₹425–430)
🚀 Breakout above resistance could trigger 20–25% rally towards ₹500+
⚠️ Breakdown below ₹400 may drag stock back to ₹370 levels.
Aviso legal
As informações e publicações não se destinam a ser, e não constituem, conselhos ou recomendações financeiras, de investimento, comerciais ou de outro tipo fornecidos ou endossados pela TradingView. Leia mais nos Termos de Uso.
Aviso legal
As informações e publicações não se destinam a ser, e não constituem, conselhos ou recomendações financeiras, de investimento, comerciais ou de outro tipo fornecidos ou endossados pela TradingView. Leia mais nos Termos de Uso.