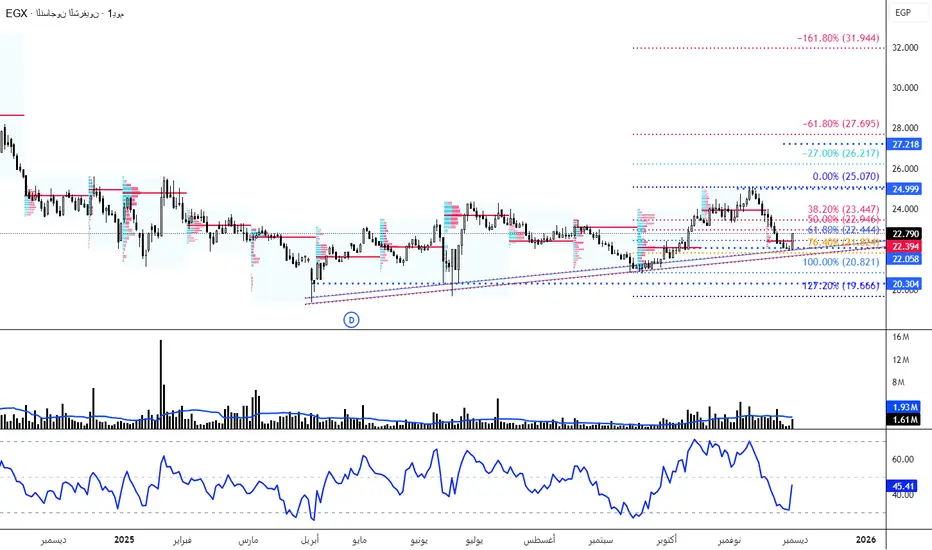
يتحرك السهم داخل نطاق عرضي متوسط المدى، مع اتجاه صاعد مائل للعرضي على الإطار القصير، محافظًا على التداول أعلى منطقة الدعم الرئيسية 22.00، والتي تتقاطع أيضًا مع خط الاتجاه الصاعد، مما يمنح المنطقة قوة إضافية.
الارتفاع الأخير جاء مصحوبًا بـ أحجام تداول إيجابية، مع اقتراب السهم من مستوى 76.40% فيبوناتشي، وهو مستوى ذو حساسية عالية لحركة السهم.
المتوقع خلال الفترة القادمة
مع الثبات أعلى 22.00، يُرجّح استمرار الزخم الإيجابي ليستهدف السهم 23.45 ثم منطقة بين مستويات (24.50-25.00) التي باختراقها يستهدف مستويات 26.20
الإغلاق أسفل 22.00 يلغي السيناريو الإيجابي ويفعّل وقف الخسائر.
------------------------------------------------------------------------------------------------
The stock is moving within a medium-term sideways range while maintaining a mildly bullish short-term trend, holding above the key support zone at 22.00, which also intersects with the rising trendline—adding additional strength to this level.
The latest upward move has been accompanied by positive trading volumes, with the price approaching the 76.40% Fibonacci retracement, a highly sensitive level for price action.
Expected Outlook
As long as the price remains above 22.00, the positive momentum is likely to continue, targeting 23.45, followed by the 24.50–25.00 resistance area.
A confirmed breakout above this zone opens the way toward 26.20.
Stop-Loss
A daily close below 22.00 invalidates the bullish scenario and activates the stop-loss level.
-----------------------------------------------------------------------
التحليل المالى
ROE العائد على حقوق الملكية
الأرقام (آخر 6 أرباع):
11.13% → 15.67% → 15.20% → 11.90% → 15.77% → 15.23%
التحليل:
• ROE مستقر في نطاق 11% – 16%، وهو مستوى مقبول لكنه ليس مرتفعًا.
• يعكس قدرة الشركة على الحفاظ على ربحية جيدة رغم تقلبات التكلفة وخامات الإنتاج.
• عدم وجود نمو كبير في ROE يعني أن الربحية تتحرك بشكل أفقي.
أثره على السهم:
يدعم الاتجاه العرضي للسهم على المدى المتوسط، ولا يعطي زخمًا صعوديًا قويًا بدون تحسن في المبيعات أو الهوامش.
العائد على الأصول
الأرقام:
10.47% → 14.73% → 14.36% → 11.33% → 15.05% → 14.59%
التحليل:
• ROA جيد نسبيًا ويظهر مرونة في التشغيل.
• يعكس قدرة الشركة على تحقيق أرباح مقبولة من أصولها التشغيلية.
• التحسن الأخير يشير إلى تحسن إدارة التكلفة وكفاءة الإنتاج.
أثره على السهم:
ROA الجيد يدعم استقرار السهم، لكنه لا يزال أقل من مستوى يدفع المؤسسات للشراء بقوة.
________________________________________
Net Profit Margin هامش صافي الربح
الأرقام:
6.81% → 13.32% → 9.27% → 8.48% → 14.30% → 9.57%
التحليل:
• الهامش غير مستقر ويتذبذب بناءً على أسعار الخامات وشحن الصادرات.
• القفزة عند 14% إيجابية، لكن عودته إلى 9% يعكس استمرار الضغوط التشغيلية.
• التذبذب يعكس عدم ثبات ربحية الشركة بسبب ارتباطها بأسواق تصدير وتقلب أسعار المواد الخام.
أثره على السهم:
عدم استقرار الهامش هو أحد أسباب تحرك السهم في اتجاه عرضي وعدم تكوين اتجاه صاعد قوي.
Free Cash Flow per Share التدفق النقدي الحر للسهم
الأرقام:
0.10 → 1.37 → 1.73 → 1.77 → 0.25 → 0.97
التحليل:
• التدفق النقدي الحر جيد نسبيًا، لكنه تأثر مؤخرًا بارتفاع المصروفات الرأسمالية CAPEX.
• الانخفاض من 1.77 إلى 0.25 يمثل ضغطًا ماليًا مؤقتًا.
• العودة إلى 0.97 تعكس بداية تحسن في التدفقات النقدية.
أثره على السهم:
تراجع FCF سابقًا كان سببًا في ضعف الزخم، بينما تحسنه مؤخرًا يمنح دعمًا للحركة الصاعدة قصيرة الأجل.
Debt-to-Equity نسبة الدين لحقوق الملكية
الأرقام:
0.51 → 0.48 → 0.45 → 0.45 → 0.47 → 0.47 → (ثم 0.51 في آخر ربع)
التحليل:
• مستويات الدين منخفضة جدًا مقارنة بالقطاع.
• هذا يعكس هيكل مالي آمن وقدرة الشركة على تمويل نشاطها بدون اعتماد كبير على الاقتراض.
• الارتفاع الطفيف الأخير طبيعي ولا يشكل خطرًا.
أثره على السهم:
منخفض المخاطر ماليًا، مما يسمح للسهم بالحفاظ على استقرار نسبي حتى لو تراجعت الأرباح التشغيلية.
________________________________________
• ربحية مستقرة ولكن ليست قوية بما يكفي لدفع انفجار سعري.
• التذبذب في الهوامش يعكس اعتماد الشركة على طلب التصدير وأسعار الخامات.
• هيكل ديون آمن جدًا يخفف مخاطر التشغيل ويجعل السهم منخفض المخاطر.
• تدفقات نقدية تتحسن تدريجيًا مما يدعم الاتجاه الصاعد القصير الذي ذكرناه في التحليل الفني
________________________________________
ROE – Return on Equity
Figures (last 6 quarters):
11.13% → 15.67% → 15.20% → 11.90% → 15.77% → 15.23%
Analysis:
• ROE remains stable within the 11%–16% range, which is acceptable but not particularly high.
• It reflects the company’s ability to maintain healthy profitability despite fluctuations in costs and raw material prices.
• The absence of meaningful growth in ROE indicates that profitability is moving sideways.
Impact on the stock:
A stable ROE supports the stock’s medium-term sideways trend but does not provide strong bullish momentum without improvement in sales or profit margins.
ROA – Return on Assets
Figures:
10.47% → 14.73% → 14.36% → 11.33% → 15.05% → 14–59%
Analysis:
• ROA is relatively strong and demonstrates operational resilience.
• It shows the company’s ability to generate acceptable returns from its operating assets.
• The recent improvement signals better cost management and higher production efficiency.
Impact on the stock:
A solid ROA helps stabilize the stock’s performance but remains below levels that typically attract aggressive institutional buying.
Net Profit Margin
Figures:
6.81% → 13.32% → 9.27% → 8.48% → 14.30% → 9.57%
Analysis:
• Profit margins are unstable and fluctuate noticeably based on raw material prices and export-related costs.
• The spike toward 14% is positive, but the subsequent decline back to 9% shows continued operational pressure.
• This volatility highlights the company’s sensitivity to export markets and commodity pricing.
Impact on the stock:
The inconsistent margin is one of the key reasons the stock continues to trade sideways rather than forming a strong bullish trend.
Free Cash Flow per Share
Figures:
0.10 → 1.37 → 1.73 → 1.77 → 0.25 → 0.97
Analysis:
• Free cash flow is relatively healthy but was negatively impacted by recent increases in CAPEX.
• The drop from 1.77 to 0.25 signals temporary financial pressure.
• The recovery to 0.97 indicates early signs of improving cash generation.
Impact on the stock:
The previous decline in FCF contributed to weaker momentum, while the recent improvement provides short-term support for a mild upward move.
Debt-to-Equity Ratio
Figures:
0.51 → 0.48 → 0.45 → 0.45 → 0.47 → 0.47 → (rising back to 0.51 in the latest quarter)
Analysis:
• Debt levels are very low compared to sector averages.
• This reflects a conservative and stable capital structure, enabling the company to operate without significant reliance on external borrowing.
• The slight recent uptick is not concerning and remains within safe limits.
Impact on the stock:
Low leverage reduces financial risk, helping the stock maintain relative stability even when operational profits soften.
--------------------------------------------------------------------------------------------------------
• Profitability is stable but not strong enough to trigger a significant upside breakout.
• Margin volatility reflects the company’s sensitivity to export demand and raw material price swings.
• A very safe debt structure reduces operational and financial risks, making the stock low-risk overall.
• Gradual improvement in cash flows supports the mild short-term bullish scenario highlighted in the earlier technical analysis.
Ahmed Amin
00201227212691
twitter.com/AhmedAminTC
snapchat.com/add/ahmedamintc?share_id=SQYebO-s9zs&locale=en-EG
00201227212691
twitter.com/AhmedAminTC
snapchat.com/add/ahmedamintc?share_id=SQYebO-s9zs&locale=en-EG
Aviso legal
As informações e publicações não se destinam a ser, e não constituem, conselhos ou recomendações financeiras, de investimento, comerciais ou de outro tipo fornecidos ou endossados pela TradingView. Leia mais nos Termos de Uso.