Chart Analysis:
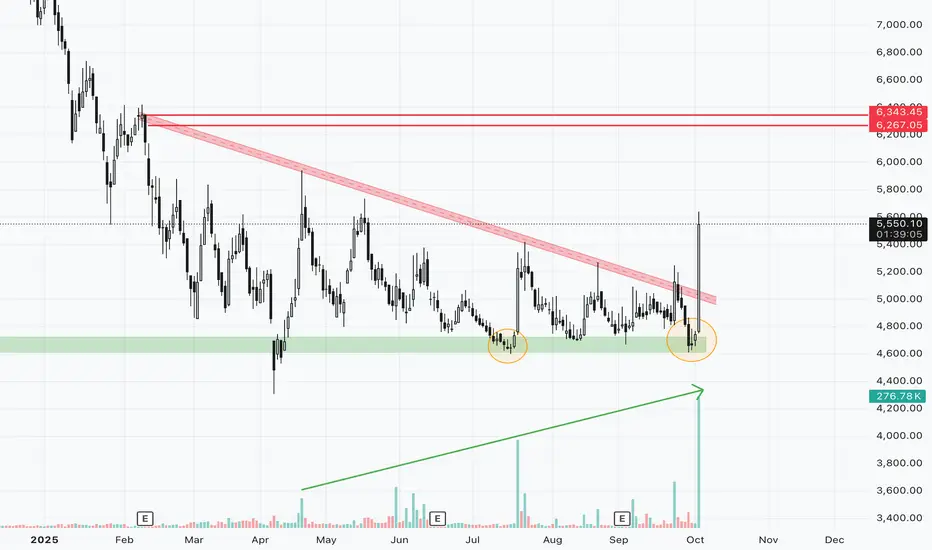
The stock has formed a flat base pattern and is now showing a breakout with strong volumes, indicating strength in the move. The weekly chart structure also supports the bullish outlook. A long position can be considered around the 5400–5450 zone.
Key Levels:
•Entry: 5400–5450
•Targets: 5750 / 5930 / 6130 / 6300
•Stop-loss (short term): Daily close below 5200 (strict SL for smaller targets)
•Stop-loss (positional 3–4 months): Daily close below 4700
Disclaimer:
I am not SEBI registered. This analysis is for educational purposes only and not investment advice. Please do your own research before trading or investing.
Aviso legal
As informações e publicações não se destinam a ser, e não constituem, conselhos ou recomendações financeiras, de investimento, comerciais ou de outro tipo fornecidos ou endossados pela TradingView. Leia mais nos Termos de Uso.
Aviso legal
As informações e publicações não se destinam a ser, e não constituem, conselhos ou recomendações financeiras, de investimento, comerciais ou de outro tipo fornecidos ou endossados pela TradingView. Leia mais nos Termos de Uso.