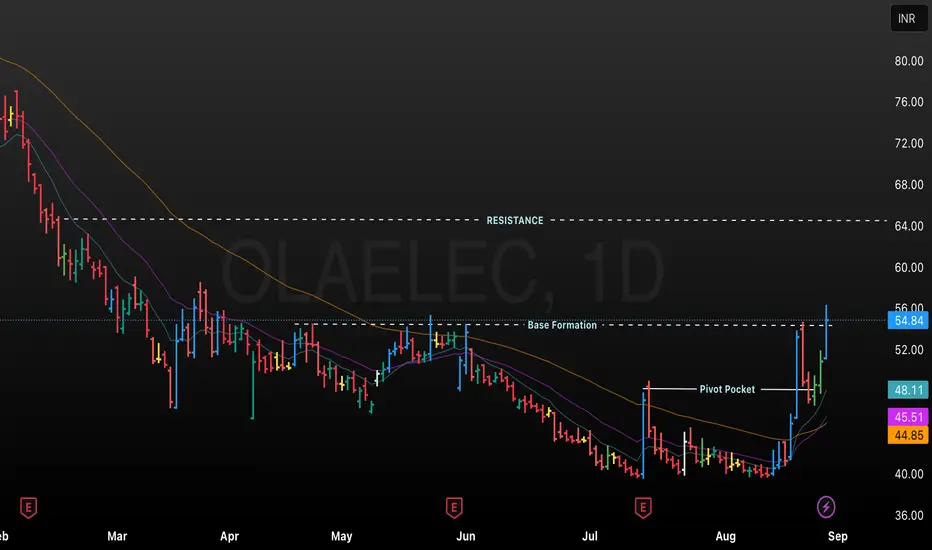
This chart displays the daily candlestick price action for OLA Electric, showing trends from February to August. Key technical levels are annotated, such as Resistance near 64, a Base Formation region, and a Pivot Pocket, indicating areas of price consolidation and breakout attempts. Moving averages (possibly 20-day, 50-day, and 200-day) are included, and the latest price is 54.84 INR, with a significant gain of +7.91% on the day. The chart is useful for analyzing support, resistance, and trend development in OLA Electric’s stock
Aviso legal
As informações e publicações não devem ser e não constituem conselhos ou recomendações financeiras, de investimento, de negociação ou de qualquer outro tipo, fornecidas ou endossadas pela TradingView. Leia mais em Termos de uso.
Aviso legal
As informações e publicações não devem ser e não constituem conselhos ou recomendações financeiras, de investimento, de negociação ou de qualquer outro tipo, fornecidas ou endossadas pela TradingView. Leia mais em Termos de uso.