Weekly chart- 
1. Pattern Analysis
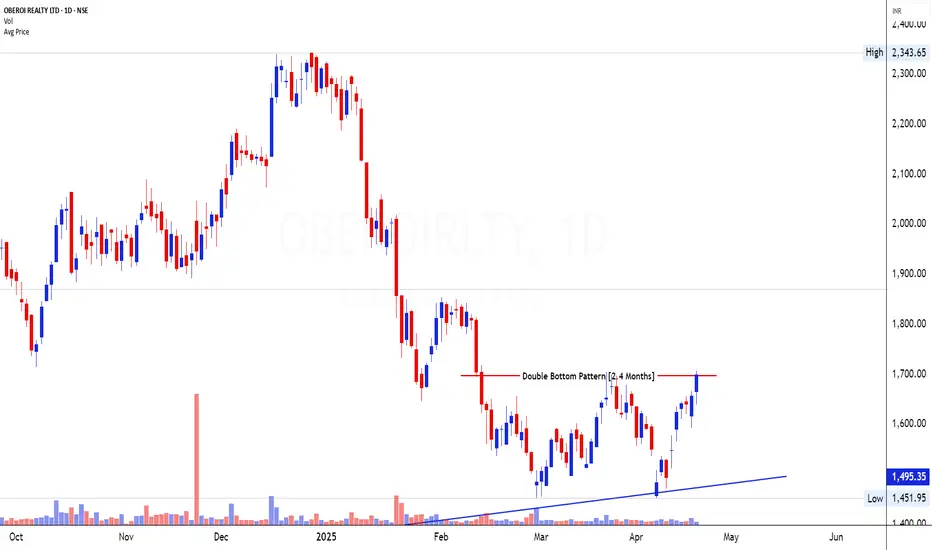
OBEROI REALTY LTD has recently formed a Double Bottom Pattern on the daily chart, spanning approximately 2.4 months. This pattern is a classic bullish reversal formation that typically occurs after a prolonged downtrend and signals a potential trend reversal. The pattern is well-structured with two clear troughs formed at similar price levels, which reflect strong demand around the ₹1495–₹1510 zone. The neckline resistance of this double bottom lies near ₹1700.
On the weekly chart, a broader market structure supports this bullish outlook with the price respecting a 2.3-year diagonal support line. This long-term ascending trendline reflects sustained investor confidence and buying interest at gradually higher levels over time. The confluence of a medium-term reversal pattern on the daily chart and the structural support on the weekly chart adds to the strength of the setup.
2. Volume Analysis
Volume behavior further validates the credibility of this bullish setup. Over the past several sessions, there has been a notable increase in volume during bullish moves, especially during the formation of the second bottom of the double bottom pattern. This indicates active participation from market participants and adds credibility to the bounce.
The breakout attempt toward the ₹1700 resistance zone has also been accompanied by rising volume, suggesting real demand rather than speculative activity. Additionally, the weekly volume has picked up compared to the average of the previous few weeks, signaling fresh accumulation at lower price zones. This volume expansion near support zones and pattern breakouts is a key strength signal and often precedes sustainable rallies.
3. Candlestick Analysis / Price Action
On the daily timeframe, the price action has shown consistent strength over the past few trading sessions with multiple bullish candlesticks forming near the breakout zone. Notably, large-bodied bullish candles with minor upper wicks have emerged, indicating strong intraday buying interest and conviction at these levels. The absence of heavy selling pressure at the neckline of the pattern suggests that bears are currently losing control.
The weekly candlestick structure adds further confidence, showing a strong bullish candle forming near the long-term diagonal support zone. This setup reinforces the probability of an upward breakout being genuine rather than a fake-out. The alignment of price action on both daily and weekly charts shows strong institutional interest and bullish sentiment building up.
4. Validation of Signal
The current market action confirms a valid breakout attempt of the double bottom neckline around ₹1700. While the price has not yet achieved a clean breakout on a closing basis, the strong rally and the increasing bullish momentum indicate that a confirmed breakout is likely imminent. The rising volume near the neckline supports this observation.
Moreover, the stock has respected the multi-year diagonal trendline on the weekly chart, which has acted as a springboard for the recent rally. The strength of this trendline as a support, coupled with the breakout of a bullish reversal pattern on the daily chart, makes the signal highly reliable. The validation comes from multi-timeframe confluence, which significantly increases the probability of a successful uptrend continuation.
5. Tradable Points Determination
Entry Point Determination
A favorable entry point would be on a breakout above ₹1710 on a daily closing basis. However, for aggressive traders, a partial position could be initiated near the current levels around ₹1695–₹1700 with a focus on confirmation in the upcoming sessions. Conservative traders may wait for a daily close above ₹1710 with increased volume.
Target Point Determination
Based on the height of the double bottom pattern (approx. ₹210), the projected target can be estimated at:
Target 1: ₹1850 – Psychological round number and initial hurdle post breakout
Target 2: ₹1920 – Pattern-measured target from the neckline breakout
Given the overall bullish market tone and weekly support structure, these targets are both reasonable and achievable in the short to medium term.
Stop Loss Placement and Trailing SL Follow-Up
A logical stop loss for this trade setup should be placed below ₹1620, just under the recent bullish swing low and above the second bottom, which also coincides with the rising trendline on the daily chart. As the trade progresses and price crosses ₹1780–₹1800 levels, traders should consider trailing the stop loss higher to protect gains, ideally using the 5-day or 10-day EMA or below key swing lows formed during the rally.
1. Pattern Analysis
OBEROI REALTY LTD has recently formed a Double Bottom Pattern on the daily chart, spanning approximately 2.4 months. This pattern is a classic bullish reversal formation that typically occurs after a prolonged downtrend and signals a potential trend reversal. The pattern is well-structured with two clear troughs formed at similar price levels, which reflect strong demand around the ₹1495–₹1510 zone. The neckline resistance of this double bottom lies near ₹1700.
On the weekly chart, a broader market structure supports this bullish outlook with the price respecting a 2.3-year diagonal support line. This long-term ascending trendline reflects sustained investor confidence and buying interest at gradually higher levels over time. The confluence of a medium-term reversal pattern on the daily chart and the structural support on the weekly chart adds to the strength of the setup.
2. Volume Analysis
Volume behavior further validates the credibility of this bullish setup. Over the past several sessions, there has been a notable increase in volume during bullish moves, especially during the formation of the second bottom of the double bottom pattern. This indicates active participation from market participants and adds credibility to the bounce.
The breakout attempt toward the ₹1700 resistance zone has also been accompanied by rising volume, suggesting real demand rather than speculative activity. Additionally, the weekly volume has picked up compared to the average of the previous few weeks, signaling fresh accumulation at lower price zones. This volume expansion near support zones and pattern breakouts is a key strength signal and often precedes sustainable rallies.
3. Candlestick Analysis / Price Action
On the daily timeframe, the price action has shown consistent strength over the past few trading sessions with multiple bullish candlesticks forming near the breakout zone. Notably, large-bodied bullish candles with minor upper wicks have emerged, indicating strong intraday buying interest and conviction at these levels. The absence of heavy selling pressure at the neckline of the pattern suggests that bears are currently losing control.
The weekly candlestick structure adds further confidence, showing a strong bullish candle forming near the long-term diagonal support zone. This setup reinforces the probability of an upward breakout being genuine rather than a fake-out. The alignment of price action on both daily and weekly charts shows strong institutional interest and bullish sentiment building up.
4. Validation of Signal
The current market action confirms a valid breakout attempt of the double bottom neckline around ₹1700. While the price has not yet achieved a clean breakout on a closing basis, the strong rally and the increasing bullish momentum indicate that a confirmed breakout is likely imminent. The rising volume near the neckline supports this observation.
Moreover, the stock has respected the multi-year diagonal trendline on the weekly chart, which has acted as a springboard for the recent rally. The strength of this trendline as a support, coupled with the breakout of a bullish reversal pattern on the daily chart, makes the signal highly reliable. The validation comes from multi-timeframe confluence, which significantly increases the probability of a successful uptrend continuation.
5. Tradable Points Determination
Entry Point Determination
A favorable entry point would be on a breakout above ₹1710 on a daily closing basis. However, for aggressive traders, a partial position could be initiated near the current levels around ₹1695–₹1700 with a focus on confirmation in the upcoming sessions. Conservative traders may wait for a daily close above ₹1710 with increased volume.
Target Point Determination
Based on the height of the double bottom pattern (approx. ₹210), the projected target can be estimated at:
Target 1: ₹1850 – Psychological round number and initial hurdle post breakout
Target 2: ₹1920 – Pattern-measured target from the neckline breakout
Given the overall bullish market tone and weekly support structure, these targets are both reasonable and achievable in the short to medium term.
Stop Loss Placement and Trailing SL Follow-Up
A logical stop loss for this trade setup should be placed below ₹1620, just under the recent bullish swing low and above the second bottom, which also coincides with the rising trendline on the daily chart. As the trade progresses and price crosses ₹1780–₹1800 levels, traders should consider trailing the stop loss higher to protect gains, ideally using the 5-day or 10-day EMA or below key swing lows formed during the rally.
Learn Today for Better Tomorrow
Aviso legal
As informações e publicações não se destinam a ser, e não constituem, conselhos ou recomendações financeiras, de investimento, comerciais ou de outro tipo fornecidos ou endossados pela TradingView. Leia mais nos Termos de Uso.
Learn Today for Better Tomorrow
Aviso legal
As informações e publicações não se destinam a ser, e não constituem, conselhos ou recomendações financeiras, de investimento, comerciais ou de outro tipo fornecidos ou endossados pela TradingView. Leia mais nos Termos de Uso.