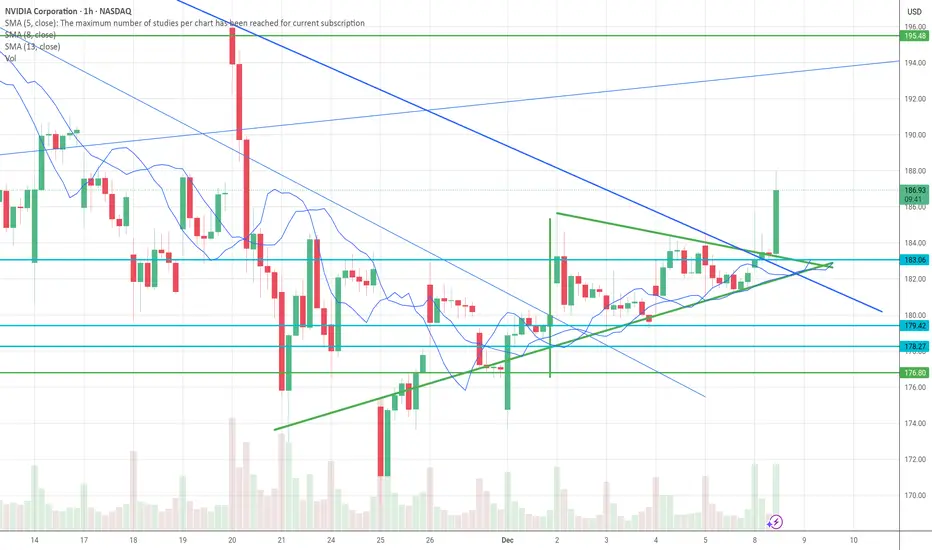
NVDA’s push above the wedge and reclaim of the 20‑EMA tilts the very short‑term bias back to bullish, but it’s breaking into nearby resistance rather than into empty space.
Where price sits now NVDA is trading around 187–188, just above today’s 20‑EMA (~184) and basically on top of the 50‑EMA/50‑SMA cluster near 187–188.
The prior month’s action had price oscillating around these MAs, so this area is a battle zone, not clean air. Short‑term technical services still flag 20‑EMA as a “Sell” and 50‑EMA as “Sell/neutral,” reflecting recent downside momentum despite today’s pop.
Wedge breakout implications A breakout above a falling wedge after a pullback in a larger uptrend is typically bullish, with measured‑move targets often taken as the wedge height projected from the breakout.
Given NVDA’s broader uptrend (200‑day EMA/SMA rising around 155–163), this looks more like a continuation setup; the breakout favors a retest of the upper recent range (low 190s, then 200+) if it holds above the 20‑EMA.
Key intraday / short‑term levelsSupport to hold the breakout:183–185: 20‑EMA zone and today’s intraday low area; losing this quickly would make today look like a fake‑out 178–180: prior micro‑swing area; below here, wedge breakout thesis weakens and risk shifts back toward 170s.Resistance / upside magnets:190–192: recent local resistance band flagged by several TA services and discretionary analysts as a sell zone on first touch.
Above 192 on strong volume opens room toward the prior high zone near 200–212 over days to weeks if the AI/semis tape cooperates.
Good luck. Fortune awaits.
This is not financial advice. Please do your due diligence.
Aviso legal
As informações e publicações não se destinam a ser, e não constituem, conselhos ou recomendações financeiras, de investimento, comerciais ou de outro tipo fornecidos ou endossados pela TradingView. Leia mais nos Termos de Uso.
Aviso legal
As informações e publicações não se destinam a ser, e não constituem, conselhos ou recomendações financeiras, de investimento, comerciais ou de outro tipo fornecidos ou endossados pela TradingView. Leia mais nos Termos de Uso.