📅 Date: 05/19/2025 | ⏱️ Timeframe: 30 minutes
🔍 Current Technical Context
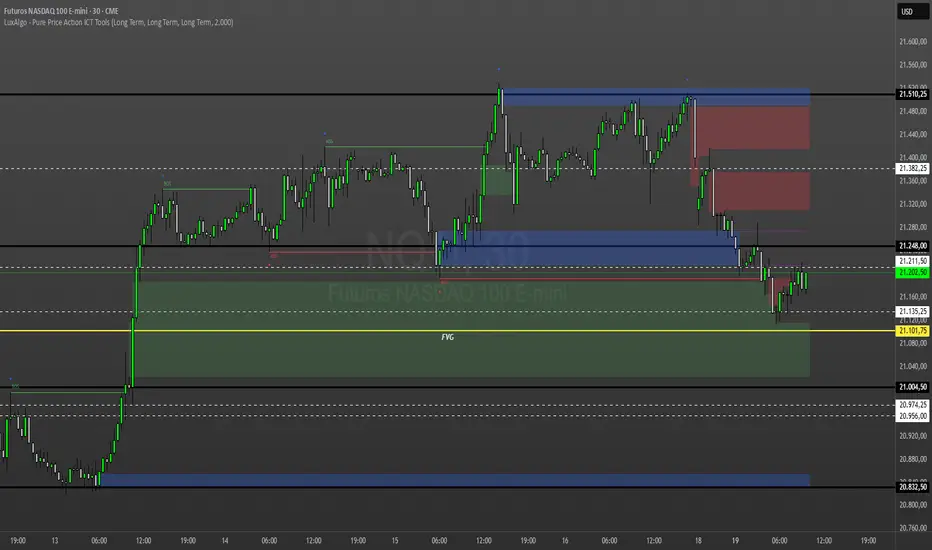
After an upward expansion that started in the 20,832.50 region, NQ1! reached the institutional liquidity zone marked at 21,510.25, where it started a redistribution and reversal process.
We can observe:
📌 BOS (Break of Structure) validating an uptrend on 05/13;
❗ MSS (Change in Market Structure) transition from bullish to bearish;
🔻 Strong liquidity captured at the top and institutional selling started in the premium region.
🧠 Main Points of Interest (POIs)
🔵 Institutional Selling Zone – 21,510.25 (Premium Zone)
Last institutional distribution region before the price change.
The presence of imbalance candles and bearish FVG was confirmed.
A strong rejection in this region indicates the entry of strong sell orders.
📍 Conclusion: Ideal region for swing selling with targets below 21,200.
🔴 Imbalance Zones and Intermediate OBs – 21,382 to 21,320
Multiple mitigation zones (red) represent pullback regions after the breakout.
This area will act as dynamic resistance if the price tries to rise.
📍 Conclusion: Any pullback to this zone could be a new selling opportunity with a technical SL above the upper block.
🔲 Neutral Zone – 21,248.00
It marks the last low broken before the recent fall (support structure).
It currently serves as a decisive level: breaking this range could invalidate the continuation of the fall and generate a deeper pullback.
📍 Conclusion: If there is a BOS above this level, evaluate a buyer reallocation up to 21,382–21,440.
🟩 Buyer Interest Zone – 21,101.75 to 21,135.25
Fair Value Gap region + previous buyer block (green zone).
The region is approved with a discount level in the range, highly favorable for institutional purchases.
📍 Conclusion: Critical observation point for a possible short-term reversal.
🟡 Main FVG – 21,101.75 (marked in yellow)
Clean, unmitigated gap, generated by strong price movement.
Immediate rejection in this range may mark the beginning of a new expansion.
📍Conclusion: Valid technical trigger for damaging purchases if there is a contamination candle with above-average volume.
⚫ Massive Support – 20,832.50 (Base of the movement)
Zone of origin of the institutional rally.
Contains the last concentration of long-term buying orders.
📍 Conclusion: If the price returns to this range, expect defensive action with a possible sell trap (FU).
🧭 NEXUS Strategic Scenarios
📈 Bullish Scenario (bullish reversal)
🔹Clear rejection in the FVG of 21,101.75; 🔹 BOS above 21,248 confirms bullish structure;
🔹 Target: Upside mitigation at 21,382 and then 21,510.
📉 Bearish Scenario (continuation of the fall)
🔻 Failure to cover 21,248;
🔻 Strong rejection in the sell zones at 21,320;
🔻 Final Target: Retest of the previous bottom at 20,832.
📌Operational Summary
Region Type Relevant Stock
21,510.25 Institutional Selling Short Term
21,382–21,320 Supply Mitigation Pullback to New Selling
21,248.00 Technical BOS Level Reversal Confirmation
21,101.75–21,135.25 FVG Buy Zone Institutional Defensive Entry
20,832.50 Primary Support Last Bullish Defense
🔒 This reading is based on the Nexus Method, which anticipates institutional movements with clarity, logic, and precision.
💡 Want to learn how to identify zones like these and trade side by side with the big players?
📲 Contact me via direct message to get free access to the next tactical class or join our daily operations group.
🔍 Current Technical Context
After an upward expansion that started in the 20,832.50 region, NQ1! reached the institutional liquidity zone marked at 21,510.25, where it started a redistribution and reversal process.
We can observe:
📌 BOS (Break of Structure) validating an uptrend on 05/13;
❗ MSS (Change in Market Structure) transition from bullish to bearish;
🔻 Strong liquidity captured at the top and institutional selling started in the premium region.
🧠 Main Points of Interest (POIs)
🔵 Institutional Selling Zone – 21,510.25 (Premium Zone)
Last institutional distribution region before the price change.
The presence of imbalance candles and bearish FVG was confirmed.
A strong rejection in this region indicates the entry of strong sell orders.
📍 Conclusion: Ideal region for swing selling with targets below 21,200.
🔴 Imbalance Zones and Intermediate OBs – 21,382 to 21,320
Multiple mitigation zones (red) represent pullback regions after the breakout.
This area will act as dynamic resistance if the price tries to rise.
📍 Conclusion: Any pullback to this zone could be a new selling opportunity with a technical SL above the upper block.
🔲 Neutral Zone – 21,248.00
It marks the last low broken before the recent fall (support structure).
It currently serves as a decisive level: breaking this range could invalidate the continuation of the fall and generate a deeper pullback.
📍 Conclusion: If there is a BOS above this level, evaluate a buyer reallocation up to 21,382–21,440.
🟩 Buyer Interest Zone – 21,101.75 to 21,135.25
Fair Value Gap region + previous buyer block (green zone).
The region is approved with a discount level in the range, highly favorable for institutional purchases.
📍 Conclusion: Critical observation point for a possible short-term reversal.
🟡 Main FVG – 21,101.75 (marked in yellow)
Clean, unmitigated gap, generated by strong price movement.
Immediate rejection in this range may mark the beginning of a new expansion.
📍Conclusion: Valid technical trigger for damaging purchases if there is a contamination candle with above-average volume.
⚫ Massive Support – 20,832.50 (Base of the movement)
Zone of origin of the institutional rally.
Contains the last concentration of long-term buying orders.
📍 Conclusion: If the price returns to this range, expect defensive action with a possible sell trap (FU).
🧭 NEXUS Strategic Scenarios
📈 Bullish Scenario (bullish reversal)
🔹Clear rejection in the FVG of 21,101.75; 🔹 BOS above 21,248 confirms bullish structure;
🔹 Target: Upside mitigation at 21,382 and then 21,510.
📉 Bearish Scenario (continuation of the fall)
🔻 Failure to cover 21,248;
🔻 Strong rejection in the sell zones at 21,320;
🔻 Final Target: Retest of the previous bottom at 20,832.
📌Operational Summary
Region Type Relevant Stock
21,510.25 Institutional Selling Short Term
21,382–21,320 Supply Mitigation Pullback to New Selling
21,248.00 Technical BOS Level Reversal Confirmation
21,101.75–21,135.25 FVG Buy Zone Institutional Defensive Entry
20,832.50 Primary Support Last Bullish Defense
🔒 This reading is based on the Nexus Method, which anticipates institutional movements with clarity, logic, and precision.
💡 Want to learn how to identify zones like these and trade side by side with the big players?
📲 Contact me via direct message to get free access to the next tactical class or join our daily operations group.
Aviso legal
As informações e publicações não se destinam a ser, e não constituem, conselhos ou recomendações financeiras, de investimento, comerciais ou de outro tipo fornecidos ou endossados pela TradingView. Leia mais nos Termos de Uso.
Aviso legal
As informações e publicações não se destinam a ser, e não constituem, conselhos ou recomendações financeiras, de investimento, comerciais ou de outro tipo fornecidos ou endossados pela TradingView. Leia mais nos Termos de Uso.