📝 Key levels to watch
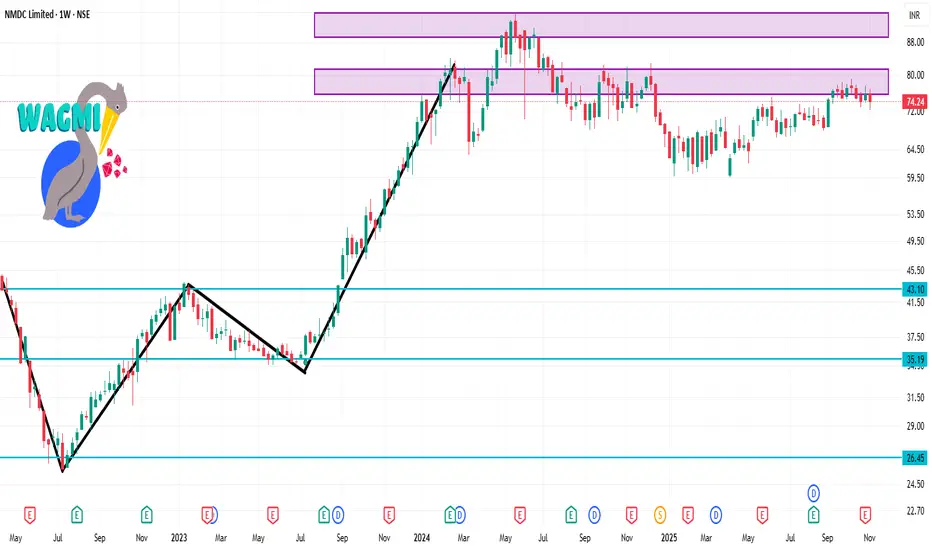
Support: ~₹74 region (short term) → if broken → ~₹69.
Resistance: ~₹78-₹79.
Price of interest: Current trading around ~₹74-₹76 (depending on the source)
✅ What the technicals are saying
a) According to one source, NMDC has a “Strong Buy” rating on daily indicators: RSI ~55, MACD positive, 5-day MA above price, 50-day MA above price — all suggesting bullish bias.
b) Another set of technicals (via Moving Averages & Oscillators) shows a Bearish bias: MACD negative, RSI ~38, SMA(20/50/200) all above current price indicating downward pressure.
c) Support / resistance levels from Charts: Short-term support around ₹74.19, intermediate support near ₹69.44, major support around ₹61.87. Resistance around ₹78.80 to ~₹79.58.
Publicações relacionadas
Aviso legal
As informações e publicações não se destinam a ser, e não constituem, conselhos ou recomendações financeiras, de investimento, comerciais ou de outro tipo fornecidos ou endossados pela TradingView. Leia mais nos Termos de Uso.
Publicações relacionadas
Aviso legal
As informações e publicações não se destinam a ser, e não constituem, conselhos ou recomendações financeiras, de investimento, comerciais ou de outro tipo fornecidos ou endossados pela TradingView. Leia mais nos Termos de Uso.