📊 Current Context
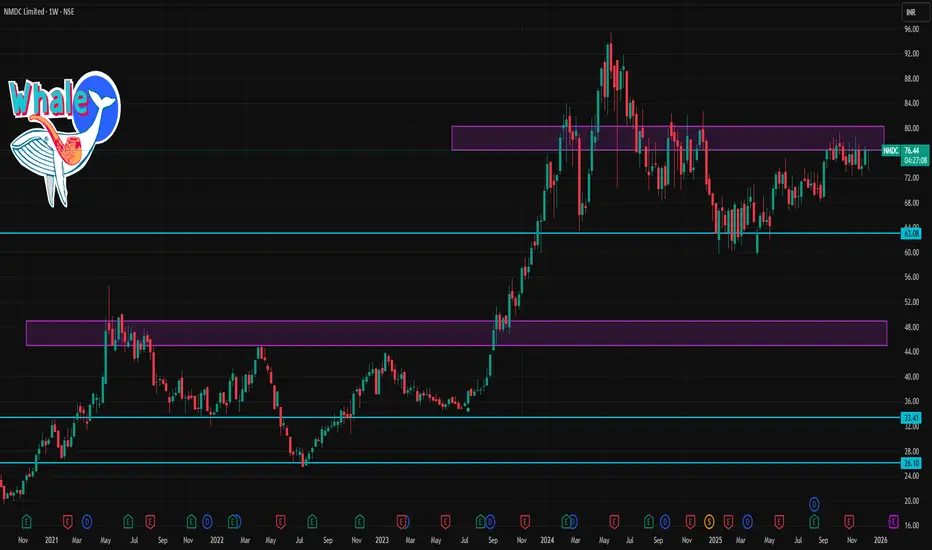
The stock is trading around ~₹74–76 recently.
🧠 Notes for the Week
Bullish scenario: Holding above ₹76 could support a move toward ₹78–80.
Bearish scenario: If price closes weekly below ₹73–72, short‑term downside may extend toward ₹71.
Pivot levels and Fibonacci retracements suggest the midpoint resistance ~₹75–76 is key for the next few sessions.
🔎 Quick Summary (1‑Week Levels)
Level Type Zone (Approx)
Strong Support ₹71–72
Immediate Support ₹73–74
Weekly Pivot ₹75.5–76
Immediate Resistance ₹76–77
Higher Resistance ₹78–79
Breakout Zone ₹80+
Publicações relacionadas
Aviso legal
As informações e publicações não se destinam a ser, e não constituem, conselhos ou recomendações financeiras, de investimento, comerciais ou de outro tipo fornecidos ou endossados pela TradingView. Leia mais nos Termos de Uso.
Publicações relacionadas
Aviso legal
As informações e publicações não se destinam a ser, e não constituem, conselhos ou recomendações financeiras, de investimento, comerciais ou de outro tipo fornecidos ou endossados pela TradingView. Leia mais nos Termos de Uso.