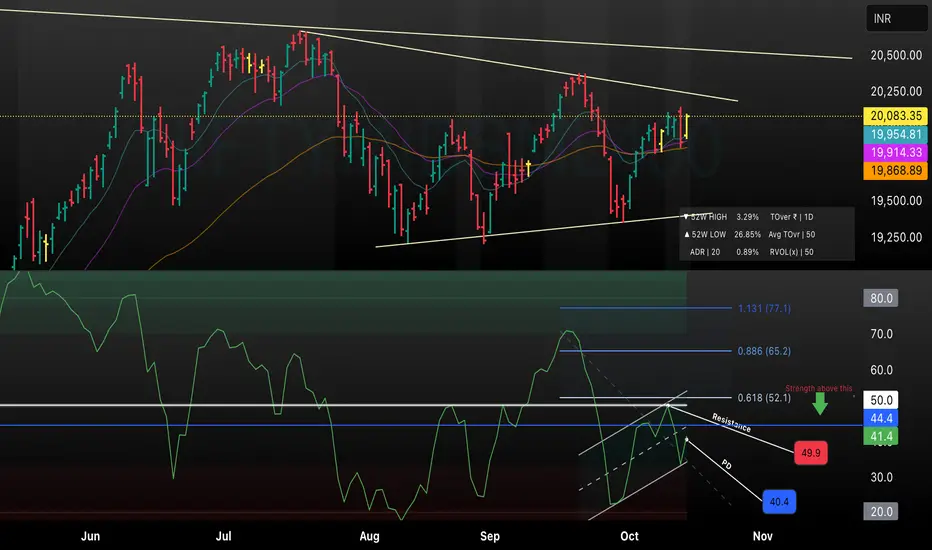
This chart replaces the RSI indicator with a market breadth analysis, offering a broader view of participation across Nifty 50 components. The lower panel now plots a key market breadth indicator such as the Advance-Decline Line or the percentage of stocks trading above key moving averages, highlighting the overall health of the index. An uptick in breadth (broad participation) near resistance lines would strengthen the bullish thesis, while weakening breadth at key levels may warn of impending reversals. This updated setup combines price channel structure, moving averages, and market breadth metrics for more robust, actionable trading decisions.
Aviso legal
As informações e publicações não se destinam a ser, e não constituem, conselhos ou recomendações financeiras, de investimento, comerciais ou de outro tipo fornecidos ou endossados pela TradingView. Leia mais nos Termos de Uso.
Aviso legal
As informações e publicações não se destinam a ser, e não constituem, conselhos ou recomendações financeiras, de investimento, comerciais ou de outro tipo fornecidos ou endossados pela TradingView. Leia mais nos Termos de Uso.