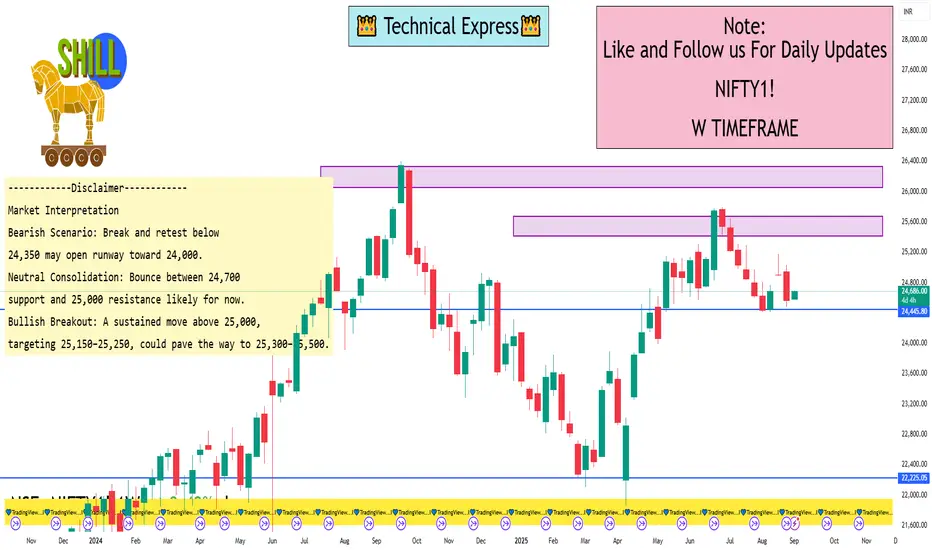
1. Technical Levels — Weekly Pivot Points & Fibonacci Zones
Thanks to TopStockResearch, here are the key pivot-derived levels for the weekly timeframe:
Standard Weekly Pivots:
Support 2 (S2): ~24,213.80
Support 1 (S1): ~24,000.80
Pivot (Central): ~24,830.70
Resistance 1 (R1): ~25,234.60
Resistance 2 (R2): ~25,447.60
Fibonacci Weekly Levels:
S2: ~24,236.46
Pivot: ~24,617.70
R1: ~24,853.36
R2: ~24,998.94
R3: ~25,234.60
Summary of horizontal price zones (support / resistance):
Support zones: 24,000 – 24,213
Pivot zone: 24,617 – 24,830
Resistance zones: 24,853 – 25,447
Additional Important Levels from Analysts & Market Reports
Consumers, Tariffs & Volatility
Analysts warn that a breakdown below 24,350 may trigger more selling pressure.
Previous Week’s Support
As of late August 2025, 24,250 has been identified as a critical support level.
Strong Support Around 24,700
Analysts indicated that there’s robust support near 24,700. A breakout above 25,150 could pave the way toward 25,300–25,500, while a dip below 24,800 might drag the index down to around 24,600.
Expected Trading Range
Market experts suggest that in the near term, the Nifty may oscillate between 24,200 and 24,800, with the 200-day exponential moving average (DEMA) acting as support around 24,200.
I built a Buy & Sell Signal Indicator with 85% accuracy.
📈 Get access via DM or
WhatsApp: wa.link/d997q0
Contact - +91 76782 40962
| Email: techncialexpress@gmail.com
| Script Coder | Trader | Investor | From India
📈 Get access via DM or
WhatsApp: wa.link/d997q0
Contact - +91 76782 40962
| Email: techncialexpress@gmail.com
| Script Coder | Trader | Investor | From India
Publicações relacionadas
Aviso legal
As informações e publicações não se destinam a ser, e não constituem, conselhos ou recomendações financeiras, de investimento, comerciais ou de outro tipo fornecidos ou endossados pela TradingView. Leia mais nos Termos de Uso.