Here’s a breakdown of the **Nifty 50 Index (15-minute chart)**
---
## 🧠 **Intraday Technical Analysis – Nifty 50 (15M TF)**
**Date:** May 28, 2025
**Pattern Observed:** Box Range Breakdown with Measured Move
**Timeframe:** 15-minute chart
---
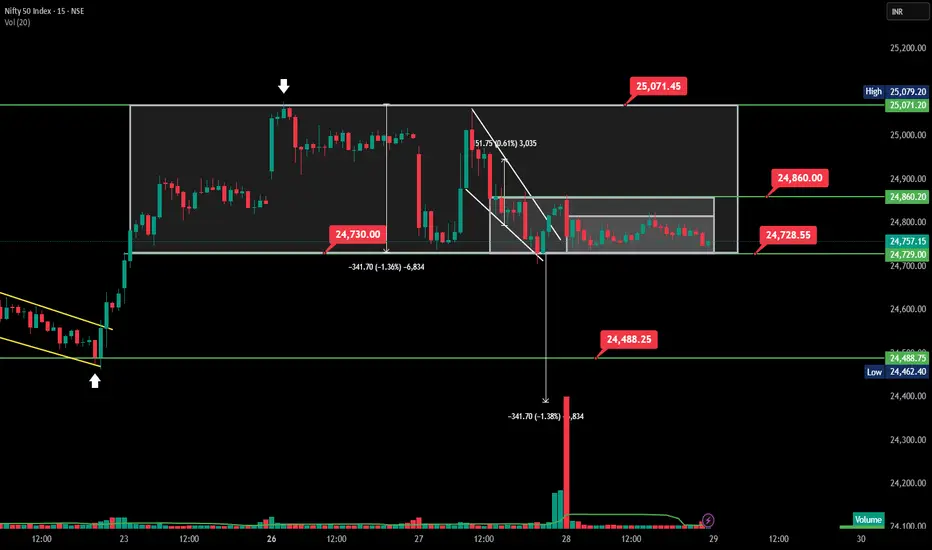
### 🔍 **1. Chart Structure**
* The index **broke out** of a falling wedge pattern but unable move above 24860.
* **Range formation:** A strong horizontal box range formed between **24,730 – 25,071**, holding for multiple sessions.
* **Breakdown:** Price broke the lower boundary at **24,730**, triggering a sell-off of \~342 points (-1.36%) down to **24,488**, which matches the **measured move**.
---
### 📉 **2. Breakdown Move**
* **Breakdown Level:** 24,730
* **Measured Target:** 24,488 (achieved perfectly)
* **Volume Spike:** Major red volume candle confirms institutional selling post-breakdown.
---
### 🔄 **3. Post Breakdown Consolidation**
* After hitting the measured target, the index formed a **mini-consolidation box** between **24,729–24,860**.
* **Price struggling to reclaim 24,860**, indicating weak intraday buying and possible continuation.
---
### 🔁 **4. Key Levels**
| Level Type | Price (₹) |
| -------------------- | --------- |
| Resistance (Box Top) | 25,071 |
| Breakdown Level | 24,730 |
| Mini-Range Top | 24,860 |
| Support/Target Hit | 24,488 |
---
### 📌 **5. Conclusion & Strategy**
* **Bias:** Bearish below 24,729
* **Next move:** If price breaks below **24,729**, a retest of **24,488–24,462** zone is likely.
* **Bullish above 24,860** only if accompanied by volume.
* **Intraday Scalping Zone:** Between 24,729–24,860 (rangebound behavior)
---
Here's a **Nifty 50 Open Interest (OI) analysis** based on the charts you've provided (as of May 28, 2025):
---
### 📊 **1. Open Interest Data Interpretation**
* **Spot Price**: 24,757.15
* **Max Pain**: 24,800
* **Put-Call Ratio (PCR)**:
* **Current PCR**: 0.888 → Slightly bearish to neutral
* **PCR (All)**: 0.6626 → Bearish sentiment
#### 🔹 Key OI Levels:
* **Highest Call OI**:
* **25,000 CE** with \~1.2 Cr contracts
* Suggests **strong resistance** at 25,000 and 24,800
* **Highest Put OI**:
* **24,500 PE** with \~78L contracts
* Suggests **strong support** at 24,500
---
### 📈 **2. Change in OI (Intraday Insight)**
* **Strong addition in Call OI** at:
* **24,800 CE**
* **24,750 CE**
* Indicates fresh short positions in calls → Bears active here
* **Put OI change**: Mixed with some unwinding around 24,900–25,000
* **Short Put unwinding** near higher levels = Reduced bullish conviction
---
### 🔍 **3. Technical Chart (15-Minute View)**
* **Price action** shows a breakdown from a range between **24,730–25,070**
* Breakdown target met at **24,488**, now consolidating in a small range
* Heavy volume seen on the breakdown → confirms strength of sellers
---
### 📌 **4. Conclusion**
| Factor | Interpretation |
| ------------------- | --------------------------- |
| PCR | Bearish (below 1) |
| Max Pain | 24,800 (neutral zone) |
| Resistance | 25,000 |
| Support | 24,500 |
| Chart Price Action | Bearish breakdown confirmed |
| Volume on Breakdown | Very high |
---
### 📣 **Strategy Insight**
* **Intraday bias**: Bearish below 24,750
* **Upside capped** at 24,860–25,000 unless short covering occurs
* **Downside support**: 24,500; break below may lead to **24,400–24,300**
---
## 🧠 **Intraday Technical Analysis – Nifty 50 (15M TF)**
**Date:** May 28, 2025
**Pattern Observed:** Box Range Breakdown with Measured Move
**Timeframe:** 15-minute chart
---
### 🔍 **1. Chart Structure**
* The index **broke out** of a falling wedge pattern but unable move above 24860.
* **Range formation:** A strong horizontal box range formed between **24,730 – 25,071**, holding for multiple sessions.
* **Breakdown:** Price broke the lower boundary at **24,730**, triggering a sell-off of \~342 points (-1.36%) down to **24,488**, which matches the **measured move**.
---
### 📉 **2. Breakdown Move**
* **Breakdown Level:** 24,730
* **Measured Target:** 24,488 (achieved perfectly)
* **Volume Spike:** Major red volume candle confirms institutional selling post-breakdown.
---
### 🔄 **3. Post Breakdown Consolidation**
* After hitting the measured target, the index formed a **mini-consolidation box** between **24,729–24,860**.
* **Price struggling to reclaim 24,860**, indicating weak intraday buying and possible continuation.
---
### 🔁 **4. Key Levels**
| Level Type | Price (₹) |
| -------------------- | --------- |
| Resistance (Box Top) | 25,071 |
| Breakdown Level | 24,730 |
| Mini-Range Top | 24,860 |
| Support/Target Hit | 24,488 |
---
### 📌 **5. Conclusion & Strategy**
* **Bias:** Bearish below 24,729
* **Next move:** If price breaks below **24,729**, a retest of **24,488–24,462** zone is likely.
* **Bullish above 24,860** only if accompanied by volume.
* **Intraday Scalping Zone:** Between 24,729–24,860 (rangebound behavior)
---
Here's a **Nifty 50 Open Interest (OI) analysis** based on the charts you've provided (as of May 28, 2025):
---
### 📊 **1. Open Interest Data Interpretation**
* **Spot Price**: 24,757.15
* **Max Pain**: 24,800
* **Put-Call Ratio (PCR)**:
* **Current PCR**: 0.888 → Slightly bearish to neutral
* **PCR (All)**: 0.6626 → Bearish sentiment
#### 🔹 Key OI Levels:
* **Highest Call OI**:
* **25,000 CE** with \~1.2 Cr contracts
* Suggests **strong resistance** at 25,000 and 24,800
* **Highest Put OI**:
* **24,500 PE** with \~78L contracts
* Suggests **strong support** at 24,500
---
### 📈 **2. Change in OI (Intraday Insight)**
* **Strong addition in Call OI** at:
* **24,800 CE**
* **24,750 CE**
* Indicates fresh short positions in calls → Bears active here
* **Put OI change**: Mixed with some unwinding around 24,900–25,000
* **Short Put unwinding** near higher levels = Reduced bullish conviction
---
### 🔍 **3. Technical Chart (15-Minute View)**
* **Price action** shows a breakdown from a range between **24,730–25,070**
* Breakdown target met at **24,488**, now consolidating in a small range
* Heavy volume seen on the breakdown → confirms strength of sellers
---
### 📌 **4. Conclusion**
| Factor | Interpretation |
| ------------------- | --------------------------- |
| PCR | Bearish (below 1) |
| Max Pain | 24,800 (neutral zone) |
| Resistance | 25,000 |
| Support | 24,500 |
| Chart Price Action | Bearish breakdown confirmed |
| Volume on Breakdown | Very high |
---
### 📣 **Strategy Insight**
* **Intraday bias**: Bearish below 24,750
* **Upside capped** at 24,860–25,000 unless short covering occurs
* **Downside support**: 24,500; break below may lead to **24,400–24,300**
Aviso legal
As informações e publicações não devem ser e não constituem conselhos ou recomendações financeiras, de investimento, de negociação ou de qualquer outro tipo, fornecidas ou endossadas pela TradingView. Leia mais em Termos de uso.
Aviso legal
As informações e publicações não devem ser e não constituem conselhos ou recomendações financeiras, de investimento, de negociação ou de qualquer outro tipo, fornecidas ou endossadas pela TradingView. Leia mais em Termos de uso.