🔑 Key Highlights
(1) Control Line as Key Zone
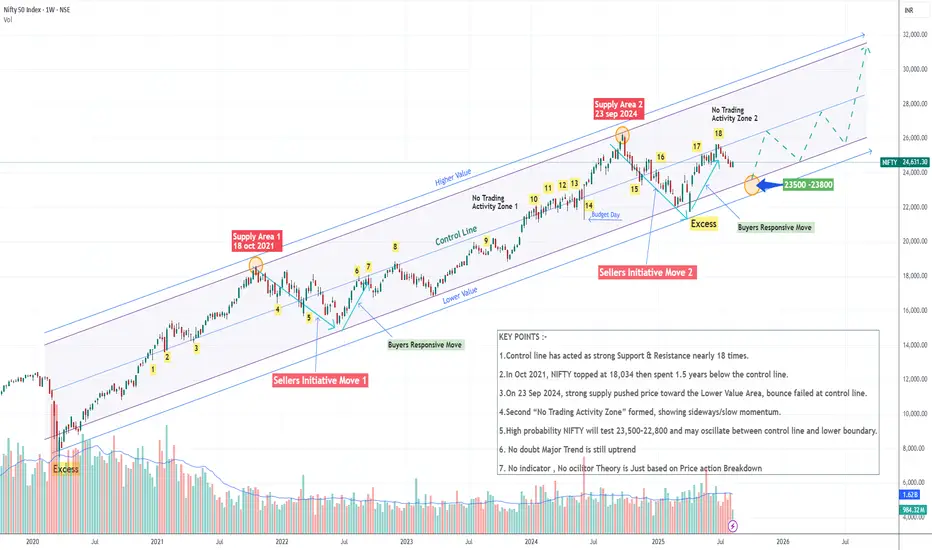
➡️The control line has acted as strong support and resistance multiple times (around 18 confirmations).
(2) Historical Example (Oct 2021)
➡️On 18 Oct 2021, NIFTY made a new high at 18,034.
➡️ The selling pressure was so intense that the index spent nearly 1.5 years trading below the control line.
(3) Recent Supply Zone (Sep 2024)
➡️On 23 Sep 2024, heavy selling activity pushed the market down toward the lower value area.
➡️Even after rebounding, the index once again faced resistance at the control line.
(4) No Trading Activity Zones
➡️The market has already formed one such zone in the past.
➡️Now a second “no trading activity zone” has been confirmed, showing reduced momentum and sideways behavior.
(5) Next Possible Move
➡️There is a high probability that NIFTY will attempt to test the Lower Value Area (23,500–22,800).
➡️After that, the market may oscillate between the control line and the lower boundary before deciding its next major direction.
👉 This entire analysis is based purely on DAMIR’s Price Action Breakdown theory, no indictor, no oscillator had been used.
(1) Control Line as Key Zone
➡️The control line has acted as strong support and resistance multiple times (around 18 confirmations).
(2) Historical Example (Oct 2021)
➡️On 18 Oct 2021, NIFTY made a new high at 18,034.
➡️ The selling pressure was so intense that the index spent nearly 1.5 years trading below the control line.
(3) Recent Supply Zone (Sep 2024)
➡️On 23 Sep 2024, heavy selling activity pushed the market down toward the lower value area.
➡️Even after rebounding, the index once again faced resistance at the control line.
(4) No Trading Activity Zones
➡️The market has already formed one such zone in the past.
➡️Now a second “no trading activity zone” has been confirmed, showing reduced momentum and sideways behavior.
(5) Next Possible Move
➡️There is a high probability that NIFTY will attempt to test the Lower Value Area (23,500–22,800).
➡️After that, the market may oscillate between the control line and the lower boundary before deciding its next major direction.
👉 This entire analysis is based purely on DAMIR’s Price Action Breakdown theory, no indictor, no oscillator had been used.
Aviso legal
As informações e publicações não devem ser e não constituem conselhos ou recomendações financeiras, de investimento, de negociação ou de qualquer outro tipo, fornecidas ou endossadas pela TradingView. Leia mais em Termos de uso.
Aviso legal
As informações e publicações não devem ser e não constituem conselhos ou recomendações financeiras, de investimento, de negociação ou de qualquer outro tipo, fornecidas ou endossadas pela TradingView. Leia mais em Termos de uso.