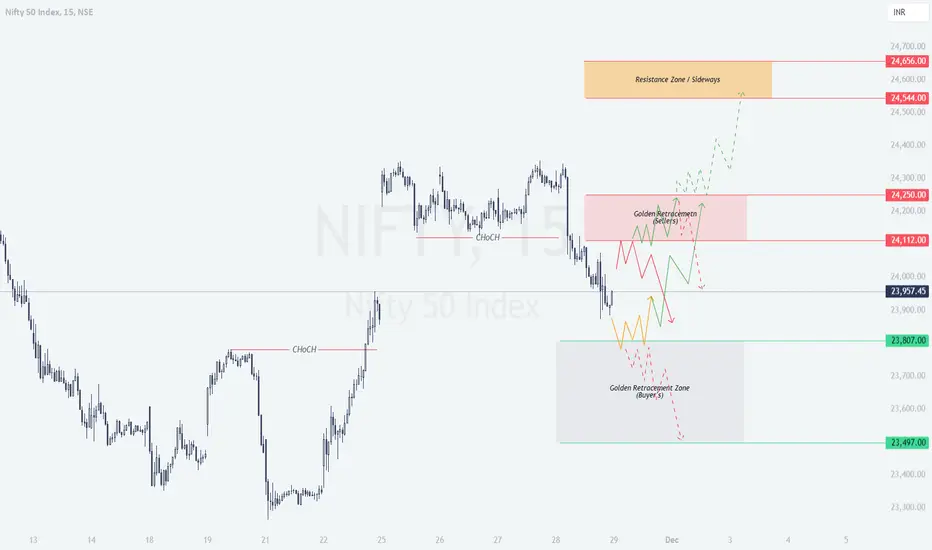
On the previous trading day, Nifty exhibited a significant shift in momentum. A Change of Character (ChoCH) was observed, indicating a possible transition between bullish and bearish phases. The index traded near the golden retracement zones, showing both buyer and seller activity. The yellow trend represents a sideways market, green signals a bullish trend, and red indicates bearish sentiment.
After a consolidation, NIFTY has shown a significant trending move on last trading session, so most probably nifty can trade sideways or in a range on Friday, but based on the chart, I have prepared trading plans for three possible opening scenarios: Gap Up, Flat, and Gap Down openings.
Gap Up Opening (+100 points or more above ₹23,957)
- Resistance Focus (₹24,112-₹24,250): If Nifty opens above ₹24,057, it will directly test the golden retracement zone for sellers. Watch for bearish patterns, such as shooting stars or evening stars, in this area. If selling pressure emerges, initiate a short position.
Action Plan:
Entry: Short below ₹24,200 after confirmation of rejection.
Target: ₹23,957 (the current close) and ₹23,807 (demand zone).
Stop Loss: Above ₹24,300 to manage risk. - Breakout Potential (₹24,250+): If Nifty breaks above ₹24,250 with strong volumes, it may head toward the Resistance Zone (₹24,544-₹24,656). Consider a long trade upon breakout confirmation.
Action Plan:
Entry: Long above ₹24,250 after a 15-minute candle close.
Target: ₹24,544 and ₹24,656.
Stop Loss: Below ₹24,100 to safeguard against false breakouts.
Flat Opening (Near ₹23,957)
- Golden Retracement (₹24,112): If the market consolidates around ₹23,957, wait for a decisive move. The immediate focus will be the golden retracement zone at ₹24,112.
Action Plan:
Entry: Long above ₹24,112 if the price breaks this level with volume.
Target: ₹24,250 and ₹24,544.
Stop Loss: Below ₹23,900 to minimize risk. - Demand Zone (₹23,807): If Nifty fails to sustain above ₹23,957, it could test the Golden Retracement Zone for Buyers (₹23,807-₹23,497). Look for bullish reversal patterns in this zone for long entry.
Action Plan:
Entry: Long near ₹23,807 if bullish candles like hammers form.
Target: ₹23,957 and ₹24,112.
Stop Loss: Below ₹23,497 to protect against breakdowns.
Gap Down Opening (-100 points or more below ₹23,957)
- Demand Zone Test (₹23,807-₹23,497): If Nifty gaps down and opens near or below ₹23,807, focus on the demand zone. This zone is critical for potential reversals.
Action Plan:
Entry: Long near ₹23,807-₹23,497 after confirming bullish patterns.
Target: ₹23,957 and ₹24,112.
Stop Loss: Below ₹23,497 to limit losses. - Breakdown Scenario (Below ₹23,497): A breakdown below ₹23,497 signals strong bearish momentum. Short positions can be taken if confirmed by volume and candle patterns.
Action Plan:
Entry: Short below ₹23,497 after confirmation.
Target: ₹23,300-₹23,100.
Stop Loss: Above ₹23,600 to avoid unnecessary risks.
Risk Management Tips for Options Trading
- []Limit your position size to ensure no single trade risks more than 2% of your capital.[]Use hedging strategies, such as buying protective puts or selling covered calls, to offset potential losses.
[]Avoid trading during the first 15-30 minutes of market opening, as this period is highly volatile.
[]Monitor implied volatility (IV) for options and select contracts with reasonable premiums to avoid overpaying.
Summary and Conclusion
This trading plan is designed to cater to multiple scenarios, ensuring you're prepared regardless of the market's direction. The key lies in observing critical levels like ₹24,112 and ₹23,807 and waiting for confirmation before entering trades.
Remember: Yellow trends indicate sideways movement, green signals bullish momentum, and red shows bearish sentiment. Stick to the plan, respect stop losses, and prioritize capital preservation.
Disclaimer:
I am not a SEBI-registered analyst. This trading plan is for educational purposes only. Please consult with your financial advisor or conduct your analysis before making any trading decisions.
Aviso legal
As informações e publicações não devem ser e não constituem conselhos ou recomendações financeiras, de investimento, de negociação ou de qualquer outro tipo, fornecidas ou endossadas pela TradingView. Leia mais em Termos de uso.
Aviso legal
As informações e publicações não devem ser e não constituem conselhos ou recomendações financeiras, de investimento, de negociação ou de qualquer outro tipo, fornecidas ou endossadas pela TradingView. Leia mais em Termos de uso.