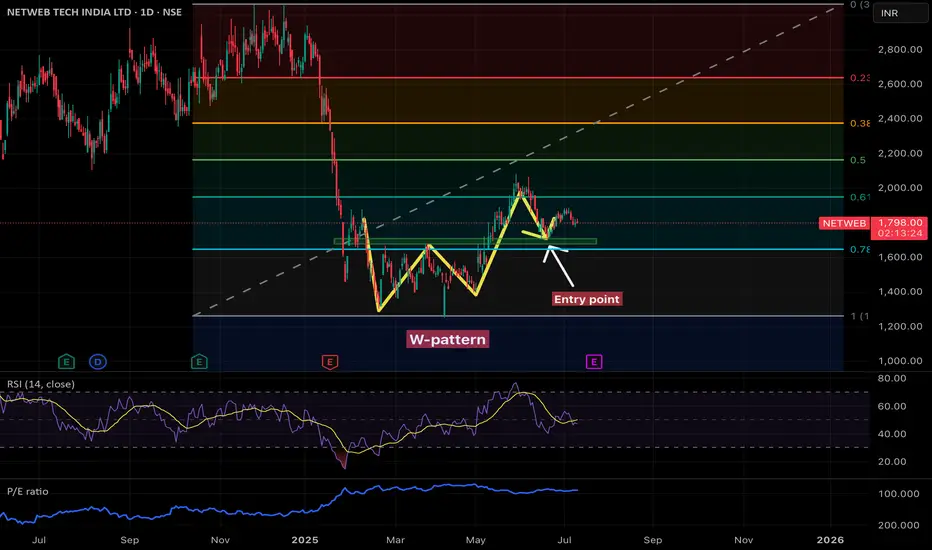
🧩 Chart Type: Daily (1D)
🔍 Pattern Observed: W-Pattern (Double Bottom)
• The W-pattern (double bottom) is a bullish reversal pattern.
• It indicates that the stock found strong support at a similar price level twice, suggesting potential accumulation.
• Breakout occurred after the second bottom, which was followed by a rally.
🎯 Key Technical Elements:
✅ Entry Point:
• Clearly marked just after the breakout from the neckline of the W-pattern.
• This aligns with a previous resistance level turning into support — a classic bullish confirmation.
• The green zone shows a support area, acting as a cushion for price retracement.
📏 Fibonacci Retracement Levels:
• Levels shown range from 0 to 1 (bottom to top of the recent trend).
• Price is hovering near the 0.618 Fibonacci level, a key retracement support (often termed the “golden ratio”).
• Below 0.618 lies the 0.786 level, which aligns with the marked support area — critical zone to watch for bulls.
📉 Indicators:
🔵 RSI (Relative Strength Index - 14):
• Currently in the neutral zone (~40-50) — neither overbought nor oversold.
• RSI previously bounced from oversold levels during W-pattern formation.
• No bullish divergence noted currently, but a bounce from 40 RSI could trigger a buying signal.
📘 P/E Ratio (Blue Line):
• Remains relatively steady after a spike — valuation seems to have normalized.
• Watch for any sharp moves that deviate from price action.
📌 Support and Resistance:
• Support:
• 1,700–1,750 INR (green zone, 0.786 level, neckline retest)
Resistance:
• ~1,950 INR (0.618 Fibonacci level)
• ~2,200 INR (0.5 Fibonacci level)
⚠️ Risk Factors:
• If price closes below the 0.786 retracement zone, W-pattern may fail.
• Volume data isn’t shown in detail, so confirmation on breakout strength is missing.
• A break below 1,650 INR could trigger stop-losses and invalidate the pattern.
✅ Conclusion:
• Bullish bias remains intact as long as price holds above the neckline and Fibonacci support.
• Entry near the support zone (green box) offers a favorable risk-to-reward ratio.
• Target levels: 1,950, 2,200, and possibly 2,400+ INR on trend continuation.
• Keep RSI and price action in sync for re-entry or exit signals.
Aviso legal
As informações e publicações não se destinam a ser, e não constituem, conselhos ou recomendações financeiras, de investimento, comerciais ou de outro tipo fornecidos ou endossados pela TradingView. Leia mais nos Termos de Uso.
Aviso legal
As informações e publicações não se destinam a ser, e não constituem, conselhos ou recomendações financeiras, de investimento, comerciais ou de outro tipo fornecidos ou endossados pela TradingView. Leia mais nos Termos de Uso.