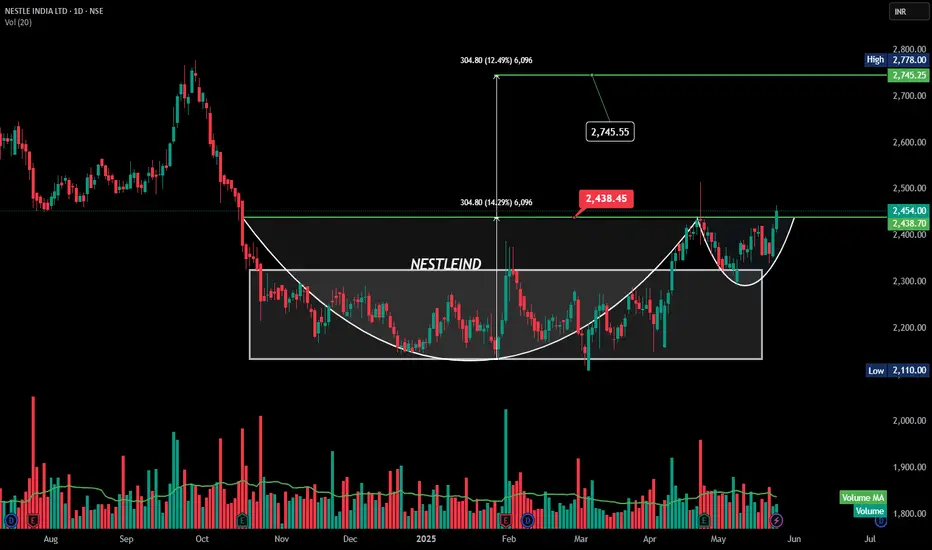
This chart of **Nestle India Ltd** shows a **Cup and Handle** breakout pattern — a strong bullish continuation signal.
---
### 🟢 **Cup & Handle Breakout – Nestle India Ltd**
#### **Pattern Highlights:**
* **Cup Formation:** Long rounding bottom from Nov 2024 to April 2025.
* **Handle:** Minor consolidation and dip in May 2025.
* **Breakout Point (Neckline):** ₹2,438.45
* **Target Projection:**
Height of cup ≈ ₹305
📈 Target = ₹2,438 + ₹305 = **₹2,745** (marked)
### ✅ Key Takeaways:
* **Breakout is with volume**, confirming strength.
* **Next resistance zones**: ₹2,745.60 and ₹2,768.60.
* **Supports post-breakout**: ₹2,438 (neckline).
Would you like a full YouTube-ready set (title, description, tags, disclaimer) for this chart as well?
Aviso legal
As informações e publicações não se destinam a ser, e não constituem, conselhos ou recomendações financeiras, de investimento, comerciais ou de outro tipo fornecidos ou endossados pela TradingView. Leia mais nos Termos de Uso.
Aviso legal
As informações e publicações não se destinam a ser, e não constituem, conselhos ou recomendações financeiras, de investimento, comerciais ou de outro tipo fornecidos ou endossados pela TradingView. Leia mais nos Termos de Uso.