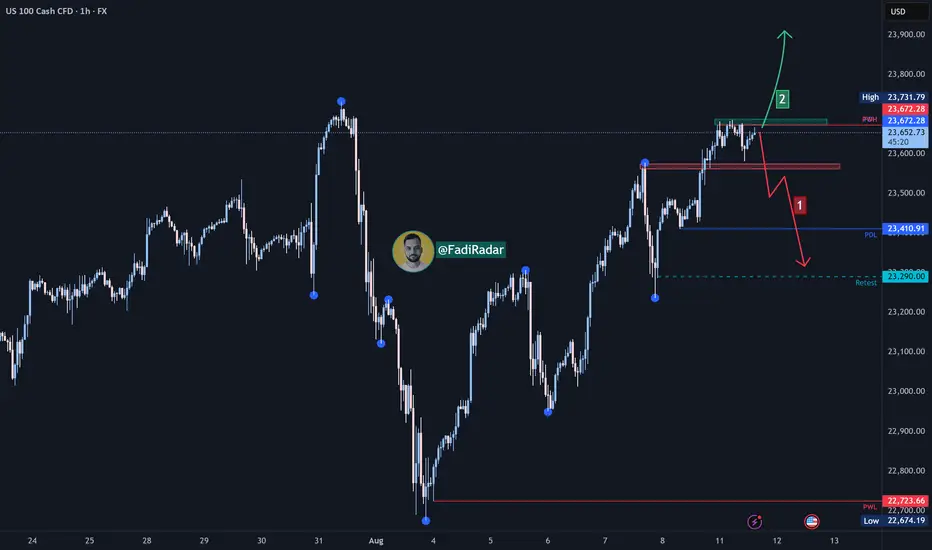
The index is currently trading near $23,670, a pivotal zone between two possible scenarios:
🔻 Bearish Scenario:
If the support at $23,570 is broken and the price holds below it, we may see a decline first toward $23,400, followed by an extended move toward $23,290 as a test area. A break below this level could open the door for further downside corrections.
🔺 Bullish Scenario:
If the price successfully breaks and holds above $23,680, this could support a continuation of the uptrend toward $23,800, and with sustained momentum, a new high could be targeted.
⚠️ Disclaimer:
This analysis is not financial advice. Please monitor market behavior and analyze data carefully before making any investment decisions.
Aviso legal
As informações e publicações não devem ser e não constituem conselhos ou recomendações financeiras, de investimento, de negociação ou de qualquer outro tipo, fornecidas ou endossadas pela TradingView. Leia mais em Termos de uso.
Aviso legal
As informações e publicações não devem ser e não constituem conselhos ou recomendações financeiras, de investimento, de negociação ou de qualquer outro tipo, fornecidas ou endossadas pela TradingView. Leia mais em Termos de uso.