📊 Monthly Support & Resistance Levels
Based on pivot point analysis, here are the key levels to watch:
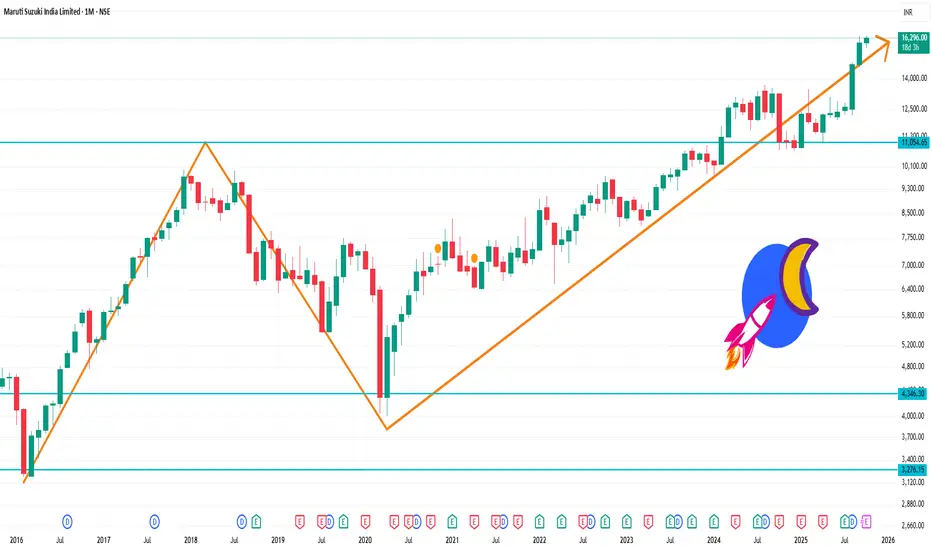
Pivot Point (PP): ₹16,163.67
Resistance Levels: ₹16,416.33 (R1), ₹16,567.67 (R2), ₹16,820.33 (R3)
Support Levels: ₹16,012.33 (S1), ₹15,759.67 (S2), ₹15,608.33 (S3)
These levels are derived from standard pivot point calculations and can serve as potential entry or exit points for traders.
Technical Indicators
Relative Strength Index (RSI): Currently at 59.15, indicating that the stock is not yet overbought and may have room for further upside.
Moving Averages: The stock is trading above its 50-day and 200-day moving averages, confirming an uptrend.
MACD: The Moving Average Convergence Divergence (MACD) is positive, suggesting bullish momentum.
Based on pivot point analysis, here are the key levels to watch:
Pivot Point (PP): ₹16,163.67
Resistance Levels: ₹16,416.33 (R1), ₹16,567.67 (R2), ₹16,820.33 (R3)
Support Levels: ₹16,012.33 (S1), ₹15,759.67 (S2), ₹15,608.33 (S3)
These levels are derived from standard pivot point calculations and can serve as potential entry or exit points for traders.
Technical Indicators
Relative Strength Index (RSI): Currently at 59.15, indicating that the stock is not yet overbought and may have room for further upside.
Moving Averages: The stock is trading above its 50-day and 200-day moving averages, confirming an uptrend.
MACD: The Moving Average Convergence Divergence (MACD) is positive, suggesting bullish momentum.
Publicações relacionadas
Aviso legal
As informações e publicações não se destinam a ser, e não constituem, conselhos ou recomendações financeiras, de investimento, comerciais ou de outro tipo fornecidos ou endossados pela TradingView. Leia mais nos Termos de Uso.
Publicações relacionadas
Aviso legal
As informações e publicações não se destinam a ser, e não constituem, conselhos ou recomendações financeiras, de investimento, comerciais ou de outro tipo fornecidos ou endossados pela TradingView. Leia mais nos Termos de Uso.