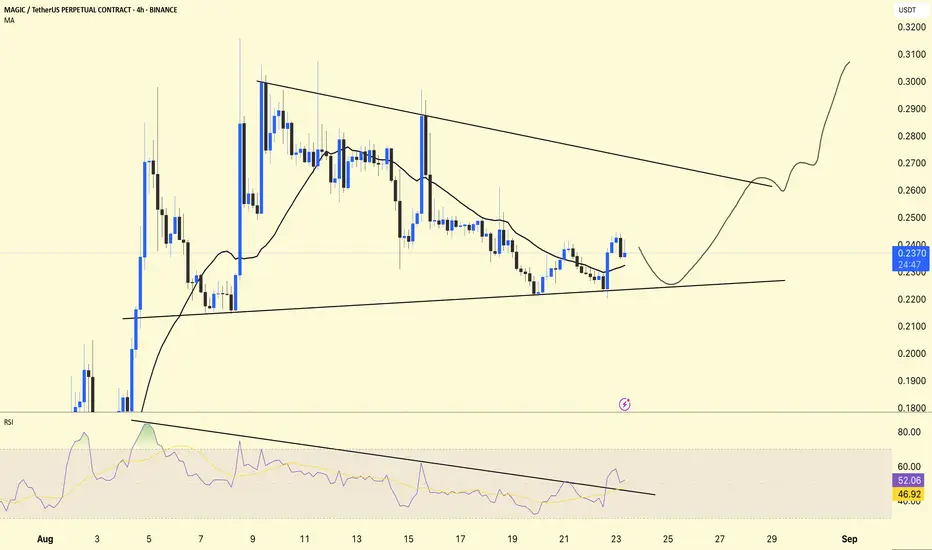
MAGIC is currently trading at $0.2376, showing a falling wedge structure with RSI breakout confirmation.
📊 Chart Overview:
Falling Wedge Pattern
The price is consolidating between a lower high and a higher low.
If it breaks to the upside, it is a bullish reversal pattern.
Support Area
Strong support (trendline support) near $0.22–0.225.
As long as this level holds, downside looks limited.
RSI Indicator
RSI = 52.64, above its MA (46.96).
RSI broke its downtrend line → early sign of bullish momentum building.
Moving Average (MA 25)
The price is slightly above the moving average (0.2324), which is a sign of short-term correction.
DYOR | NFA
Publicações relacionadas
Aviso legal
As informações e publicações não devem ser e não constituem conselhos ou recomendações financeiras, de investimento, de negociação ou de qualquer outro tipo, fornecidas ou endossadas pela TradingView. Leia mais em Termos de uso.
Publicações relacionadas
Aviso legal
As informações e publicações não devem ser e não constituem conselhos ou recomendações financeiras, de investimento, de negociação ou de qualquer outro tipo, fornecidas ou endossadas pela TradingView. Leia mais em Termos de uso.