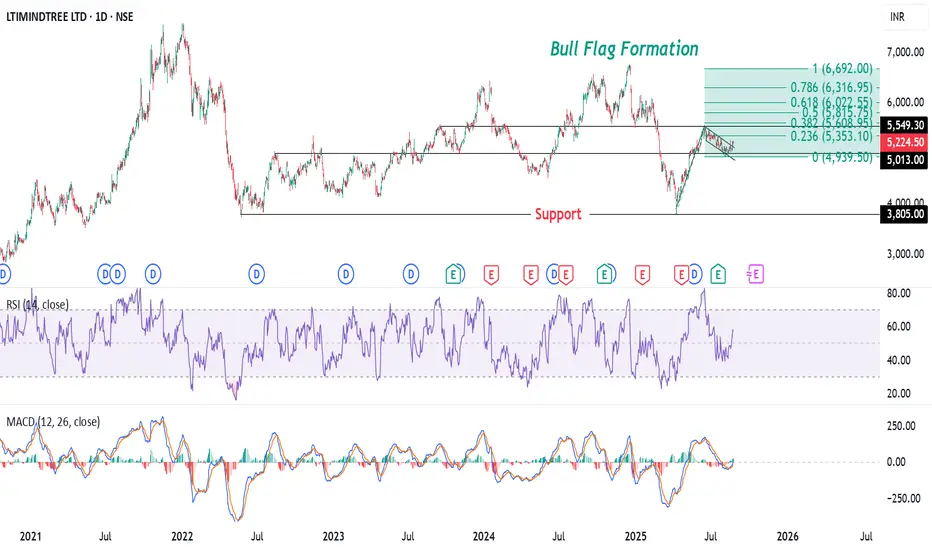
The chart of LTIMINDTREE LTD shows a Bull Flag formation, a bullish continuation pattern that typically appears after a strong upward move. The flagpole is represented by the sharp price rally, from 3,800, followed by a downward-sloping consolidation channel forming the flag.
This pattern suggests a potential breakout to the upside, supported by the Fibonacci extension levels projecting targets up to the .618 fib ext. level at ₹6,022. The RSI is near 56.89, indicating moderate strength, while the MACD shows a possible bullish crossover, further reinforcing the bullish outlook. The key support level is around ₹5,000, and a breakout above the flag could signal a resumption of the uptrend.
Disclaimer: The information provided in this analysis is for educational and informational purposes only and should not be considered as financial or investment advice.
Aviso legal
As informações e publicações não devem ser e não constituem conselhos ou recomendações financeiras, de investimento, de negociação ou de qualquer outro tipo, fornecidas ou endossadas pela TradingView. Leia mais em Termos de uso.
Aviso legal
As informações e publicações não devem ser e não constituem conselhos ou recomendações financeiras, de investimento, de negociação ou de qualquer outro tipo, fornecidas ou endossadas pela TradingView. Leia mais em Termos de uso.