Here's the **technical analysis** of **Lloyds Enterprises Ltd (NSE: LLOYDSENT)** on the **daily chart**,
---
## 📊 **Lloyds Enterprises Ltd – Daily Chart Analysis**
---
### 🧩 **Chart Patterns Observed**
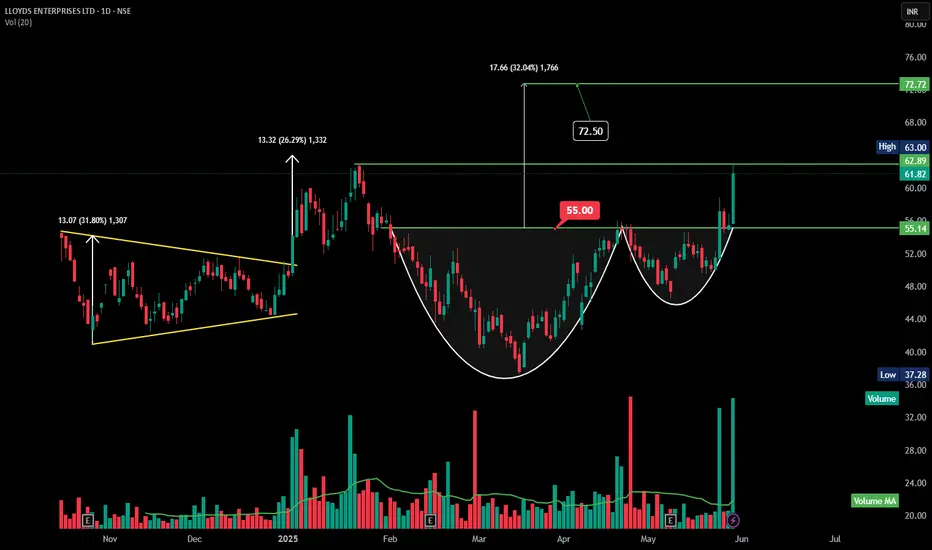
#### 2. **Cup and Handle Formation**
* A well-formed **cup and handle** pattern observed between March–May 2025.
* **Neckline breakout**: ₹55.00
* The price surged sharply after breakout, confirming pattern validity.
---
### 📏 **Price Action & Measured Targets**
| Move Type | Range | Target |
| --------------------- | ---------------------- | --------------------------------- |
| Cup & Handle Breakout | ₹55.00 → ₹72.50 | **₹72.50** (Measured Move Target) |
| Current Price | ₹61.82 | |
| Immediate Resistance | ₹63.00 | |
| Support | ₹55.14 (Breakout zone) | |
* Breakout move from ₹55 to ₹63 already achieved \~14.5% rally.
* **Next target**: ₹72.50 (as per the height of the cup added to breakout zone).
---
### 🔥 **Volume Analysis**
* Massive **volume spike** on breakout candle above ₹55.00 — signifies **strong buying interest**, likely institutional participation.
* Previous volume bars were average or decreasing → confirms **handle was low-volume** (ideal setup).
---
### 🧭 **Key Technical Levels**
| Level Type | Price (₹) |
| ------------------------ | --------------- |
| Resistance 1 (immediate) | ₹63.00 |
| Target Zone | ₹72.50 – ₹72.72 |
| Breakout Zone (Support) | ₹55.00–₹55.14 |
| Strong Support | ₹48.00 |
---
### ✅ **Technical Conclusion**
📌 **Bias**: **Strongly Bullish**
* Price broke above both **cup neckline** and **horizontal resistance** with confirmation.
* RSI likely to be nearing overbought; hence, a short pause/consolidation can occur around ₹63 before next leg up.
---
### 🎯 **Trading Strategy**
| Strategy | Plan |
| ----------------------- | ------------------------------------------------------- |
| **Swing Buy on Retest** | Enter on dip near ₹58–₹60 zone |
| **Target** | ₹72.50–₹72.72 |
| **Stop Loss** | Below ₹54.80 (close basis) |
| **Momentum Play** | Add above ₹63 on closing basis with volume confirmation |
🧠 Risk-Reward looks favorable (\~1:2+) for swing traders.
---
## 📊 **Lloyds Enterprises Ltd – Daily Chart Analysis**
---
### 🧩 **Chart Patterns Observed**
#### 2. **Cup and Handle Formation**
* A well-formed **cup and handle** pattern observed between March–May 2025.
* **Neckline breakout**: ₹55.00
* The price surged sharply after breakout, confirming pattern validity.
---
### 📏 **Price Action & Measured Targets**
| Move Type | Range | Target |
| --------------------- | ---------------------- | --------------------------------- |
| Cup & Handle Breakout | ₹55.00 → ₹72.50 | **₹72.50** (Measured Move Target) |
| Current Price | ₹61.82 | |
| Immediate Resistance | ₹63.00 | |
| Support | ₹55.14 (Breakout zone) | |
* Breakout move from ₹55 to ₹63 already achieved \~14.5% rally.
* **Next target**: ₹72.50 (as per the height of the cup added to breakout zone).
---
### 🔥 **Volume Analysis**
* Massive **volume spike** on breakout candle above ₹55.00 — signifies **strong buying interest**, likely institutional participation.
* Previous volume bars were average or decreasing → confirms **handle was low-volume** (ideal setup).
---
### 🧭 **Key Technical Levels**
| Level Type | Price (₹) |
| ------------------------ | --------------- |
| Resistance 1 (immediate) | ₹63.00 |
| Target Zone | ₹72.50 – ₹72.72 |
| Breakout Zone (Support) | ₹55.00–₹55.14 |
| Strong Support | ₹48.00 |
---
### ✅ **Technical Conclusion**
📌 **Bias**: **Strongly Bullish**
* Price broke above both **cup neckline** and **horizontal resistance** with confirmation.
* RSI likely to be nearing overbought; hence, a short pause/consolidation can occur around ₹63 before next leg up.
---
### 🎯 **Trading Strategy**
| Strategy | Plan |
| ----------------------- | ------------------------------------------------------- |
| **Swing Buy on Retest** | Enter on dip near ₹58–₹60 zone |
| **Target** | ₹72.50–₹72.72 |
| **Stop Loss** | Below ₹54.80 (close basis) |
| **Momentum Play** | Add above ₹63 on closing basis with volume confirmation |
🧠 Risk-Reward looks favorable (\~1:2+) for swing traders.
Aviso legal
As informações e publicações não se destinam a ser, e não constituem, conselhos ou recomendações financeiras, de investimento, comerciais ou de outro tipo fornecidos ou endossados pela TradingView. Leia mais nos Termos de Uso.
Aviso legal
As informações e publicações não se destinam a ser, e não constituem, conselhos ou recomendações financeiras, de investimento, comerciais ou de outro tipo fornecidos ou endossados pela TradingView. Leia mais nos Termos de Uso.