Kotak Mahindra Bank Futures (Weekly Timeframe Analysis)
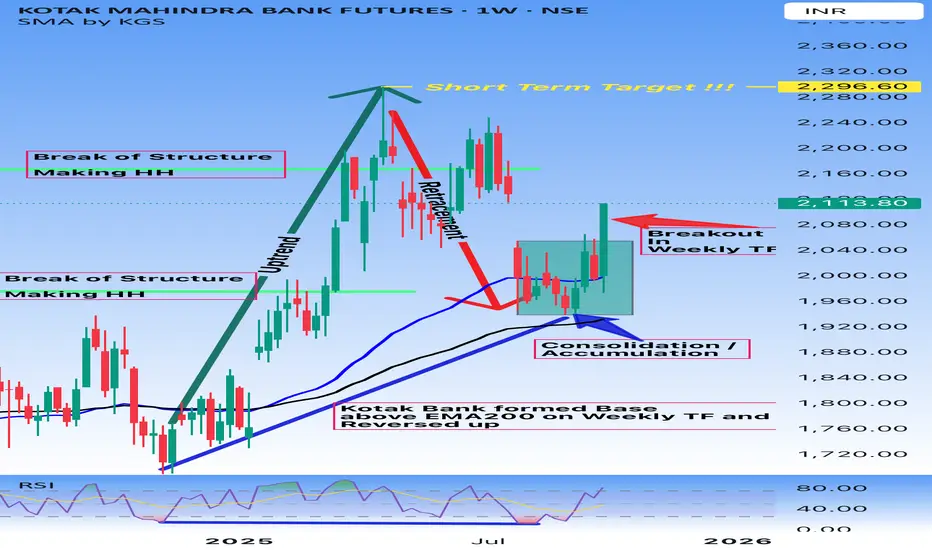
Current Price: 2,113.80
Technical Analysis:
1. Trend Structure
• Previous strong uptrend with Higher Highs (HH) formation.
• Experienced a retracement phase after topping out.
• Recently consolidated in a range, forming an accumulation zone above the 200 EMA (Weekly TF) and around 100 EMA.
2. Range Breakout Confirmation
• Range Breakout observed on the weekly timeframe after consolidation.
• Price sustained above EMA 200, showing strength.
3. Key Levels
• Support Zone: ₹1,880 – ₹1,940 (consolidation base).
• Resistance Zone / Short-Term Target: ₹2,296.60.
4. Indicators
• Hidden Divergence formed on weekly timeframe, the same area where accumulation happened & RSI bounced from oversold levels and crossed above 50, indicating renewed momentum.
• 100 EMA above 200 EMA shows the trend in favor of bulls.
🎯 Trading Plan:
• Bullish Bias: As long as the price sustains above ₹1,940–1,960 zone.
• Targets:
• Short-Term: ₹2,296.60
• Medium-Term: Higher levels possible if momentum sustains.
• Risk Management:
• Stop-loss below ₹1,880 (recent accumulation low).
Summary:
Kotak Mahindra Bank Futures has broken out from weekly consolidation after forming a strong base above EMA 200. The structure suggests the potential to move towards ₹2,296.60 in the short term, with RSI and price action both supporting bullish momentum.
Publicações relacionadas
Aviso legal
As informações e publicações não se destinam a ser, e não constituem, conselhos ou recomendações financeiras, de investimento, comerciais ou de outro tipo fornecidos ou endossados pela TradingView. Leia mais nos Termos de Uso.
Publicações relacionadas
Aviso legal
As informações e publicações não se destinam a ser, e não constituem, conselhos ou recomendações financeiras, de investimento, comerciais ou de outro tipo fornecidos ou endossados pela TradingView. Leia mais nos Termos de Uso.