Look at the Monthly and Weekly Graph and than consider the daily
many Chartist started to give sell call in Kotakbank..
My conclusion---
1- Monthly graph given only two rate in swing high low one is upar side 1648 and 1555 in Low ( It means from the Lesting Kotak never Break its trend)
2- If any stock never break its Major trend from the listing than it not suppose to sell only buy in every deep.
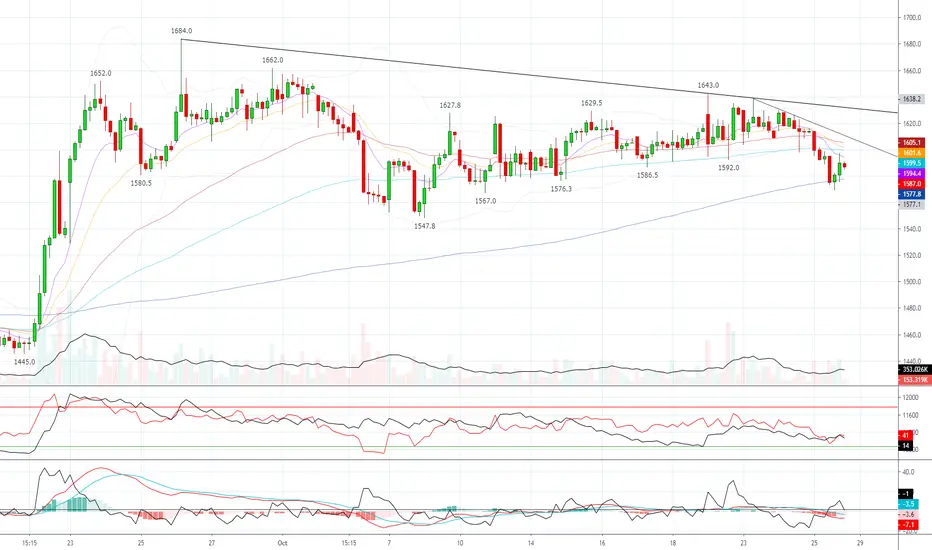
3- There is two consideration in hourly graph ( Its has good support Near 1540-1560 and currently its trading 1590 so Buy above 1604 and stoploss would be 1580 closing base)
4- Buy Buy buy target will be 1648 and More
5- This is the chance to buy Kotak with stoploss and stoploss may not done if it will 1560 closing basis
My conclusion---
1- Monthly graph given only two rate in swing high low one is upar side 1648 and 1555 in Low ( It means from the Lesting Kotak never Break its trend)
2- If any stock never break its Major trend from the listing than it not suppose to sell only buy in every deep.
3- There is two consideration in hourly graph ( Its has good support Near 1540-1560 and currently its trading 1590 so Buy above 1604 and stoploss would be 1580 closing base)
4- Buy Buy buy target will be 1648 and More
5- This is the chance to buy Kotak with stoploss and stoploss may not done if it will 1560 closing basis
Trade ativo
Trade ativo
Aviso legal
As informações e publicações não devem ser e não constituem conselhos ou recomendações financeiras, de investimento, de negociação ou de qualquer outro tipo, fornecidas ou endossadas pela TradingView. Leia mais em Termos de uso.
Aviso legal
As informações e publicações não devem ser e não constituem conselhos ou recomendações financeiras, de investimento, de negociação ou de qualquer outro tipo, fornecidas ou endossadas pela TradingView. Leia mais em Termos de uso.