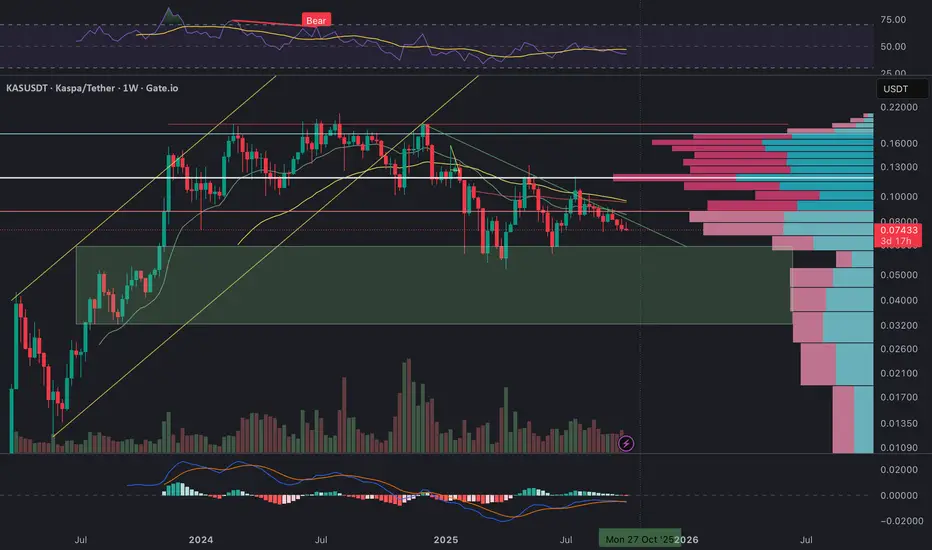
Kaspa has been consolidating for several months, drifting steadily lower within a well-defined descending channel after breaking down from the 2024 uptrend. Price is now hovering around a crucial support zone between 0.073 and 0.070 USDT, which also coincides with the lower boundary of the major demand region (highlighted in green).
From a structural point of view, KAS remains in a macro corrective phase. Momentum indicators are showing signs of exhaustion on the downside – the RSI is hovering near the 40 level and flattening out, while MACD has started to compress with a potential bullish crossover forming if buyers step in this week.
The Volume Profile clearly shows heavy supply between 0.10 – 0.12 USDT, marking this zone as the key resistance cluster that must be reclaimed to confirm any trend reversal. Until then, rallies into 0.081 – 0.085 are likely to face selling pressure.
Technically, this area around 0.074 USDT represents the “final line of defense” before a deeper retest toward 0.06 – 0.055 (the next historical demand pocket). However, if bulls manage to defend this support and push price back above the descending trendline and the 0.0815 zone, a medium-term reversal toward 0.095 – 0.10 could develop.
In short:
• Trend: Still bearish but approaching exhaustion
• Key Support: 0.073 – 0.070
• Immediate Resistance: 0.0815, then 0.090 – 0.095
• Macro Target (if breakout): 0.10 – 0.12
• Breakdown Target: 0.060 – 0.055
Volume and structure suggest we are near a make-or-break zone. A weekly close below 0.073 would confirm continuation of the downtrend, while a rebound above 0.081 could be the first real signal of accumulation before the next bullish leg.
Aviso legal
As informações e publicações não devem ser e não constituem conselhos ou recomendações financeiras, de investimento, de negociação ou de qualquer outro tipo, fornecidas ou endossadas pela TradingView. Leia mais em Termos de uso.
Aviso legal
As informações e publicações não devem ser e não constituem conselhos ou recomendações financeiras, de investimento, de negociação ou de qualquer outro tipo, fornecidas ou endossadas pela TradingView. Leia mais em Termos de uso.