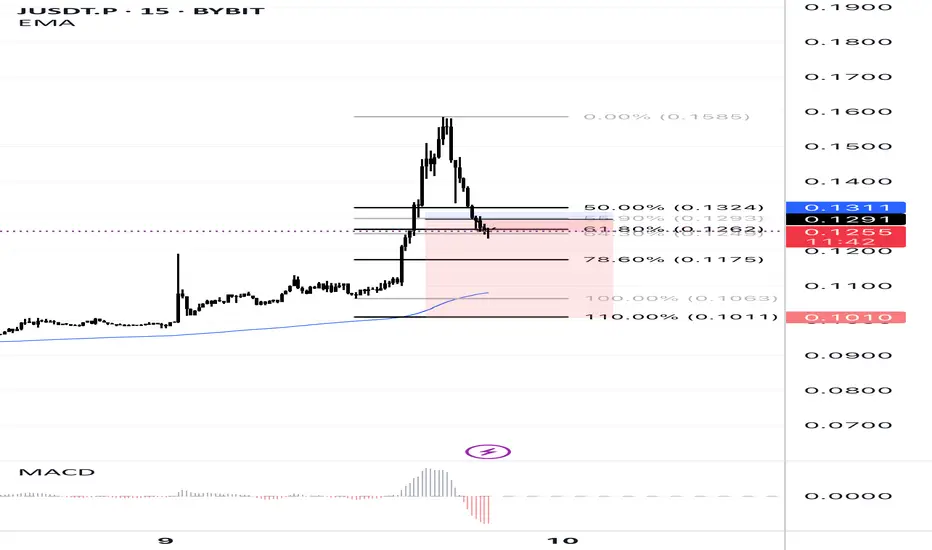
This 15-minute chart of JUSDT.P highlights a sharp price spike followed by a retracement. Key Fibonacci levels (50%, 61.8%, 78.6%) are marked to identify potential support zones. The price is currently testing the 61.8% retracement level, with the EMA acting as dynamic support. MACD shows bearish momentum after the recent peak, indicating a possible continuation of the retracement or consolidation phase. Watch for price action around the 0.1260 - 0.1320 range for potential reversal or breakdown.
Aviso legal
As informações e publicações não devem ser e não constituem conselhos ou recomendações financeiras, de investimento, de negociação ou de qualquer outro tipo, fornecidas ou endossadas pela TradingView. Leia mais em Termos de uso.
Aviso legal
As informações e publicações não devem ser e não constituem conselhos ou recomendações financeiras, de investimento, de negociação ou de qualquer outro tipo, fornecidas ou endossadas pela TradingView. Leia mais em Termos de uso.