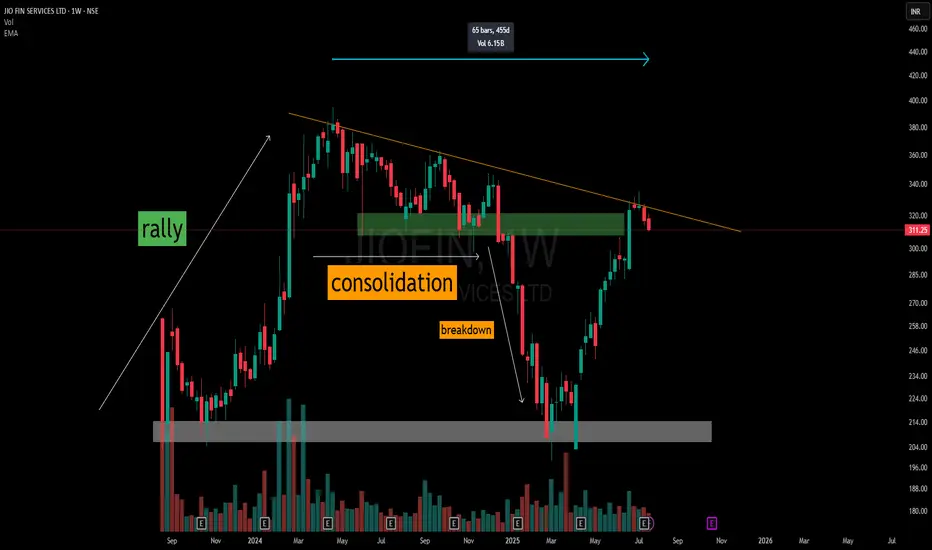
This weekly chart of Jio Fin Services Ltd illustrates a multi-phase price structure over 455 days:
🔹 Initial Rally — Kicks off from a defined accumulation base (grey zone), marking the start of a strong impulse leg.
🔹 Consolidation Phase — Price enters a descending triangle formation just below a historical resistance band.
🔹 Breakdown — Clean breakdown from the triangle pattern sends price sharply downward.
🔹 V-Shaped Recovery — A strong reaction off the original base zone leads to a sharp reversal.
🔹 Back to the 455-Day Counter Trendline — Price now tests the long-standing counter trendline, which has remained intact throughout.
📌 This chart demonstrates how historical price structures—especially well-defined base formations and trendline resistances—continue to act as critical reference points for future price action.
🛠️ No predictions here. Just a structured breakdown of price behavior and major decision zones traders are often drawn to.
🎯 Master My Self-Made Trading Strategy
📈 Telegram (Learn Today): t.me/hashtaghammer
✅ WhatsApp (Learn Today): wa.me/919455664601
📈 Telegram (Learn Today): t.me/hashtaghammer
✅ WhatsApp (Learn Today): wa.me/919455664601
Publicações relacionadas
Aviso legal
As informações e publicações não se destinam a ser, e não constituem, conselhos ou recomendações financeiras, de investimento, comerciais ou de outro tipo fornecidos ou endossados pela TradingView. Leia mais nos Termos de Uso.