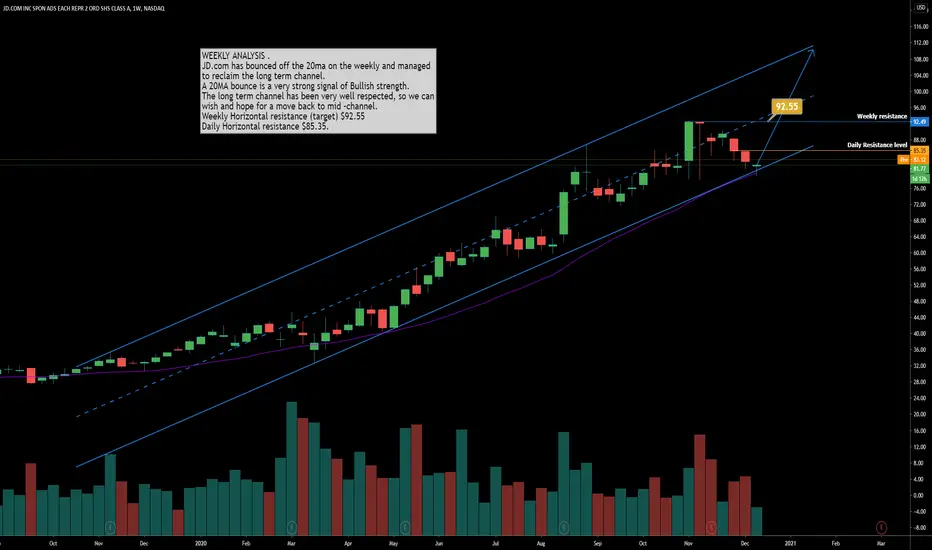
JD.com has bounced off the 20ma on the weekly and managed
to reclaim the long term channel.
A 20MA bounce is a very strong signal of Bullish strength.
The long term channel has been very well respected, so we can
wish and hope for a move back to mid -channel.
Weekly Horizontal resistance (target) $92.55
Daily Horizontal resistance $85.35.
Nota
Nota
Daily chart shows a safer entry above MA'sAviso legal
As informações e publicações não devem ser e não constituem conselhos ou recomendações financeiras, de investimento, de negociação ou de qualquer outro tipo, fornecidas ou endossadas pela TradingView. Leia mais em Termos de uso.
Aviso legal
As informações e publicações não devem ser e não constituem conselhos ou recomendações financeiras, de investimento, de negociação ou de qualquer outro tipo, fornecidas ou endossadas pela TradingView. Leia mais em Termos de uso.