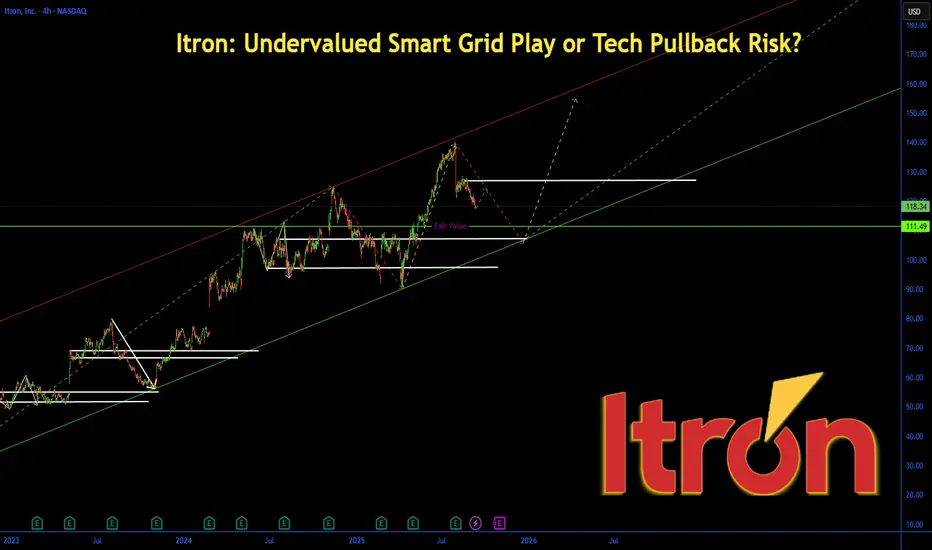
Itron: Undervalued Smart Grid Play or Tech Pullback Risk? $144 Target in Play?
Itron (ITRI) shares are trading at $118.29 today, down 0.40% from yesterday's close but up 2.5% over the past week amid broader market gains following S&P 500 and Nasdaq record highs. As a leader in smart metering and utility analytics, Itron reported record Q2 2025 profitability and raised its full-year earnings guidance, even as revenue expectations were trimmed slightly due to supply chain hiccups.
With analysts pegging a $144.40 one-year target—implying 22% upside—and the stock flagged as one of September's top undervalued picks, is ITRI poised for a breakout on IoT and energy transition tailwinds, or will sector rotation and macro jitters weigh it down? Let's dissect the fundamentals, SWOT, technicals, and setups for September 11, 2025.
Fundamental Analysis
Itron's growth is anchored in the booming demand for smart grid solutions, with Q2 2025 delivering EPS of $1.12 (beating estimates) and margins hitting all-time highs at 11.05%. Analysts forecast 2025 EPS of $6.45 on $2.5B revenue, up 10% YoY, fueled by utility digitization and partnerships in renewables. However, softer demand in some segments and persistent supply issues could pressure short-term execution if inflation lingers.
- **Positive:**
- Raised 2025 earnings guidance signals operational strength; strong backlog in smart metering amid global energy upgrades.
- Institutional buying and ETF inflows in industrials highlight undervaluation at 18.35 forward P/E versus sector average of 22x.
- Broader trends like AI-driven grid management and ESG mandates position Itron for 15%+ annual growth.
- **Negative:**
- Revenue trim in guidance reflects supply chain vulnerabilities and delayed projects.
- Economic uncertainties, including potential tariff escalations, could slow utility capex if rate cuts stall.
SWOT Analysis
**Strengths:** Dominant market position in smart metering with a 20%+ share in North America; robust R&D pipeline yielding high-margin IoT innovations and recurring software revenue.
**Weaknesses:** Heavy reliance on cyclical utility spending exposes earnings to economic downturns; elevated debt levels at 0.8x EBITDA limit flexibility amid rising rates.
**Opportunities:** Expansion into emerging markets like Asia-Pacific for grid modernization; integration of advanced analytics and AI for $11.9B global utility market by 2025 end.
**Threats:** Intensifying cybersecurity risks in connected devices; fierce competition from Siemens and Schneider, plus regulatory shifts in energy policies.
Technical Analysis
On the daily chart, ITRI is forming a bullish ascending triangle after rebounding from $115 support, with volume rising on the upside amid the broader tech rally. This follows a 3.68% monthly dip, now stabilizing near key EMAs as September forecasts eye a range of $108–$120. Current price: $118.29, with VWAP at $117.80 offering intraday balance.
Key indicators:
- **RSI (14-day):** At 52, neutral but climbing from oversold—bullish if it sustains above 55. 📈
- **MACD:** Histogram ticking positive with lines converging for a potential crossover, signaling emerging momentum. ⚠️
- **Moving Averages:** Price above the 21-day EMA ($116.50) but testing the 50-day SMA ($119)—a hold here maintains the uptrend.
Support/Resistance: Solid support at $115 (recent low and 200-day EMA), resistance at $120 (September high). Patterns/Momentum: Triangle apex approaching; breakout above $120 targets $130. 🟢 Bullish signals: Higher lows and analyst upgrades. 🔴 Bearish risks: Bearish MA trend could drag to $108 on sector weakness.
Scenarios and Risk Management
- **Bullish Scenario:** Clear $120 on strong earnings momentum or soft CPI data targets $130 short-term, then $144 by year-end. Buy dips to $115 for value entries.
- **Bearish Scenario:** Drop below $115 eyes $108 (monthly low); broader tech correction could trigger 10% pullback.
- **Neutral/Goldilocks:** Range-bound $115–$120 if data mixed, suitable for covered calls or waiting for Q3 catalysts.
Risk Tips: Set stops 2% below support ($112.70) to curb downside. Risk 1-2% of portfolio per trade. Diversify with peers like SEDG or broader industrials to dodge utility-specific traps.
Conclusion/Outlook
Overall, a bullish bias if ITRI holds $115 and guidance beats continue, cementing its undervalued status with 20%+ upside on smart grid demand.
But watch Q3 earnings and Fed minutes for confirmation—this echoes September's value rotation in tech amid record highs. What’s your take? Bullish on Itron's rebound or sidelining for now? Share in the comments!
⚡️ Request a trial or subscribe to our premium🛠️tools at ➡️DCAlpha.net
All scripts & content provided by DCAChampion are for informational & educational purposes only.
All scripts & content provided by DCAChampion are for informational & educational purposes only.
Aviso legal
As informações e publicações não se destinam a ser, e não constituem, conselhos ou recomendações financeiras, de investimento, comerciais ou de outro tipo fornecidos ou endossados pela TradingView. Leia mais nos Termos de Uso.