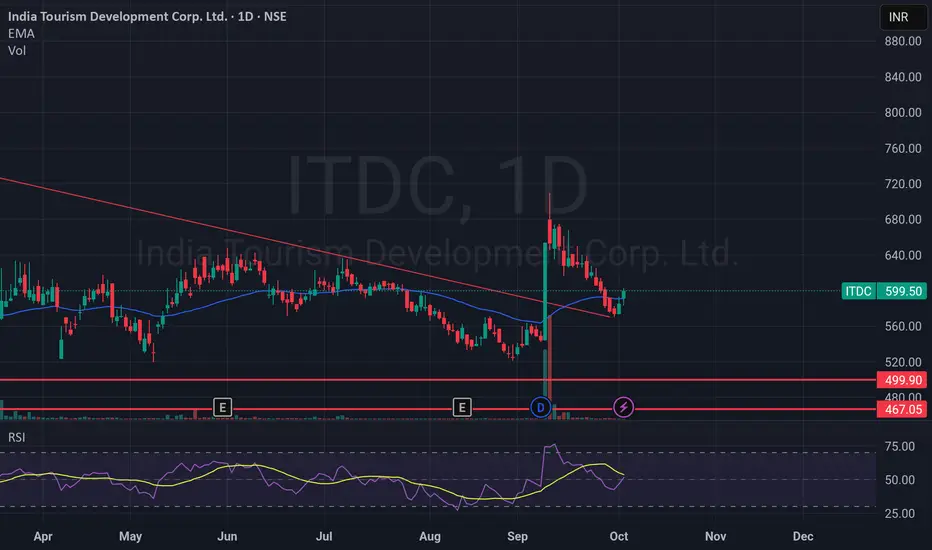
Chart & Instrument:** India Tourism Development Corp. Ltd. (ITDC) - NSE, 1D Timeframe
Analysis:
ITDC is exhibiting strength as it tests a key resistance level, poised for a potential continuation of its primary uptrend. Here's a breakdown of the technical picture:
Established Uptrend: The stock has been in a sustained uptrend since April 2025, rallying from a low of ₹467 to current levels near ₹600.
Bullish Momentum: price has closed at ₹599.50, comfortably above the key Exponential Moving Average (EMA) of ₹591.13, confirming near-term bullish momentum.
Neutral RSI: The RSI reading of ~53 is in neutral territory, indicating there is plenty of room for the stock to run before becoming overbought.
Key Resistance: The immediate and critical hurdle is the recent high of ₹603. A decisive break and close above this level are crucial for the next leg up.
Trade Idea & Prediction:
We anticipate a bullish breakout above the ₹603 resistance
Trigger: A confident break and daily close above ₹603.
Profit Target 1: ₹640 (Initial target based on previous swing highs).
Profit Target 2: ₹. 680 (Extended target, aligning with the upper boundary of the trend channel).
Stop Loss: ₹580 (A break below this key support level would invalidate the bullish setup and signal a short-term pullback).
Disclaimer :This is not financial advice. Always conduct your own research (DYOR) and manage your risk appropriately.
#ITDC #NSE #StockMarket #Trading #TechnicalAnalysis #Breakout #Investing
Aviso legal
As informações e publicações não devem ser e não constituem conselhos ou recomendações financeiras, de investimento, de negociação ou de qualquer outro tipo, fornecidas ou endossadas pela TradingView. Leia mais em Termos de uso.
Aviso legal
As informações e publicações não devem ser e não constituem conselhos ou recomendações financeiras, de investimento, de negociação ou de qualquer outro tipo, fornecidas ou endossadas pela TradingView. Leia mais em Termos de uso.