On the Weekly chart I see excellent price divergence to the MACD indicator

On the daily chart there is also an excellent price divergence towards the indicator.

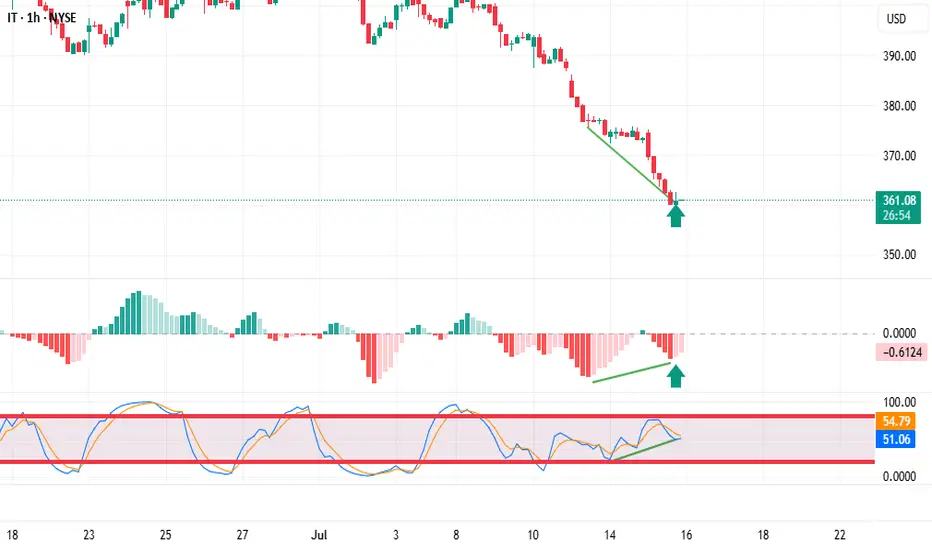
The hourly chart confirms the analysis; there is also a price divergence to the indicator.

The signal for me to enter a trade is that the histogram has stopped decreasing and changed the color of the bar from red to light pink
I placed a pending order above the bar marked with an arrow, and a stop loss below it.
 IT
IT
On the daily chart there is also an excellent price divergence towards the indicator.
The hourly chart confirms the analysis; there is also a price divergence to the indicator.
The signal for me to enter a trade is that the histogram has stopped decreasing and changed the color of the bar from red to light pink
I placed a pending order above the bar marked with an arrow, and a stop loss below it.
Nota
The price did not activate my buy order above the previous candle. Moved a buy order above the current barTrade ativo
Aviso legal
As informações e publicações não devem ser e não constituem conselhos ou recomendações financeiras, de investimento, de negociação ou de qualquer outro tipo, fornecidas ou endossadas pela TradingView. Leia mais em Termos de uso.
Aviso legal
As informações e publicações não devem ser e não constituem conselhos ou recomendações financeiras, de investimento, de negociação ou de qualquer outro tipo, fornecidas ou endossadas pela TradingView. Leia mais em Termos de uso.