Atualizado
IOSTBTC
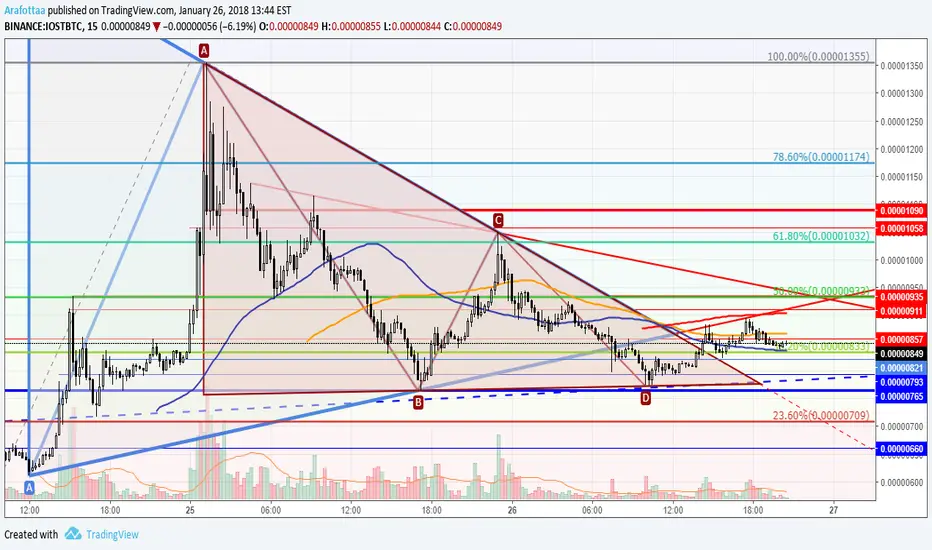
The price broke the channel on the old chart https://www.tradingview.com/chart/IOSTBTC/IxAgiQk1-IOSTBTC/
, the big triangle and the uptrend, but its rebounded above the 0.00000765 level the bottom of the small triangle to broke the triangle and the " 38% Fibonacci " to test the uptrend " bottom line of the big triangle ", but its failed to close over it, So in my opinion the price will try to test " 38% Fibonacci " again to rebound from it to 0.00000911 level.
If the price close under 0.00000821 it will go to 0.00000793 to rebound from it, If the price keep over the " 0.00000857 ", it will go to 0.00000911 to test the uptrend and the downtrend.
If the price close over " 50% Fibonacci 0.00000933 ", it will go to 0.00001090 level.
Nota
The price rebounded from 0.00000796 level above the mentioned level to create third point on the uptrend.Aviso legal
As informações e publicações não devem ser e não constituem conselhos ou recomendações financeiras, de investimento, de negociação ou de qualquer outro tipo, fornecidas ou endossadas pela TradingView. Leia mais em Termos de uso.
Aviso legal
As informações e publicações não devem ser e não constituem conselhos ou recomendações financeiras, de investimento, de negociação ou de qualquer outro tipo, fornecidas ou endossadas pela TradingView. Leia mais em Termos de uso.