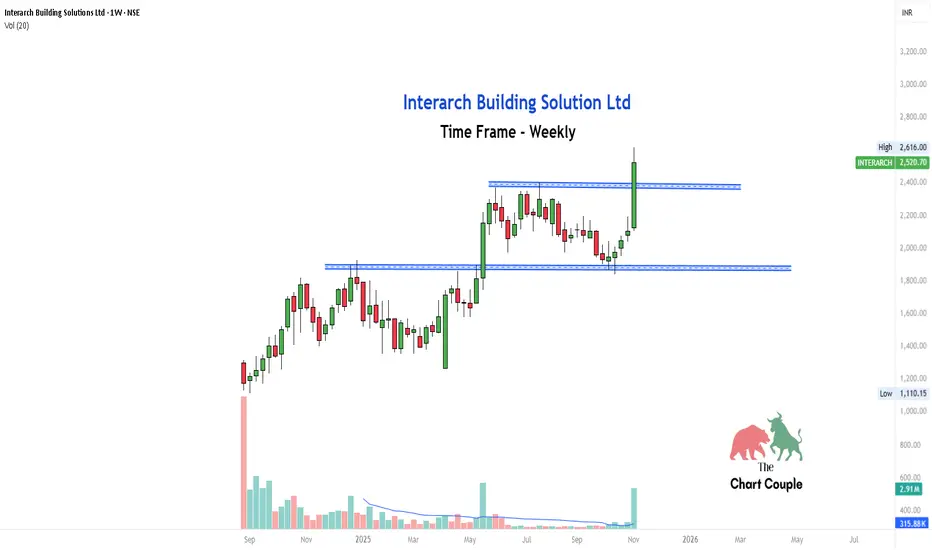
Interarch Building Solution Ltd recently broke above a well-defined resistance zone around ₹2,400 after consolidating for several weeks.
The breakout candle is supported by noticeable volume, which validates the move and makes it a strong case study for breakout learners.
What can we learn here:
Breakouts are more reliable on higher timeframes like weekly charts.
Volume expansion often precedes sustained momentum.
Patience during consolidation phases pays off when structure confirms breakout.
Aviso legal
As informações e publicações não se destinam a ser, e não constituem, conselhos ou recomendações financeiras, de investimento, comerciais ou de outro tipo fornecidos ou endossados pela TradingView. Leia mais nos Termos de Uso.
Aviso legal
As informações e publicações não se destinam a ser, e não constituem, conselhos ou recomendações financeiras, de investimento, comerciais ou de outro tipo fornecidos ou endossados pela TradingView. Leia mais nos Termos de Uso.