📈
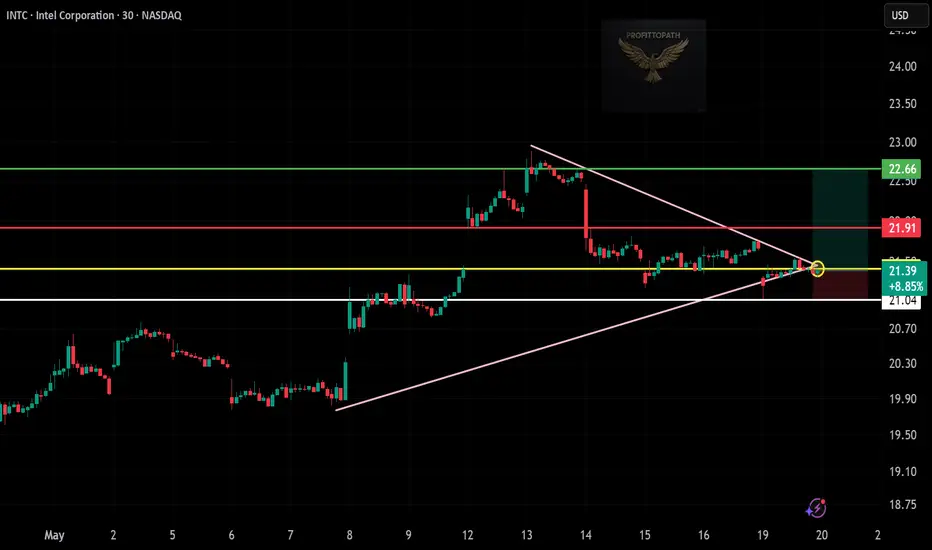
Current Price: $21.39
Pattern: Symmetrical triangle breakout (neutral-to-bullish bias)
Entry Zone: ~$21.39 (breakout confirmation)
Stop-Loss (SL): $21.04 (below triangle base/support)
Targets:
TP1: $21.91 (resistance – red line)
TP2: $22.66 (major resistance zone – green line)
🧠 Technical Highlights
Price has broken out of a tightening triangle pattern.
Yellow resistance flipped to support.
Volume not shown clearly but breakout candle shows good body.
Risk/Reward: Favorable at ~1:2 if targets hold.
🎯 Bias:
Bullish above $21.04.
Neutral or bearish below this zone.
Aviso legal
As informações e publicações não se destinam a ser, e não constituem, conselhos ou recomendações financeiras, de investimento, comerciais ou de outro tipo fornecidos ou endossados pela TradingView. Leia mais nos Termos de Uso.
Aviso legal
As informações e publicações não se destinam a ser, e não constituem, conselhos ou recomendações financeiras, de investimento, comerciais ou de outro tipo fornecidos ou endossados pela TradingView. Leia mais nos Termos de Uso.