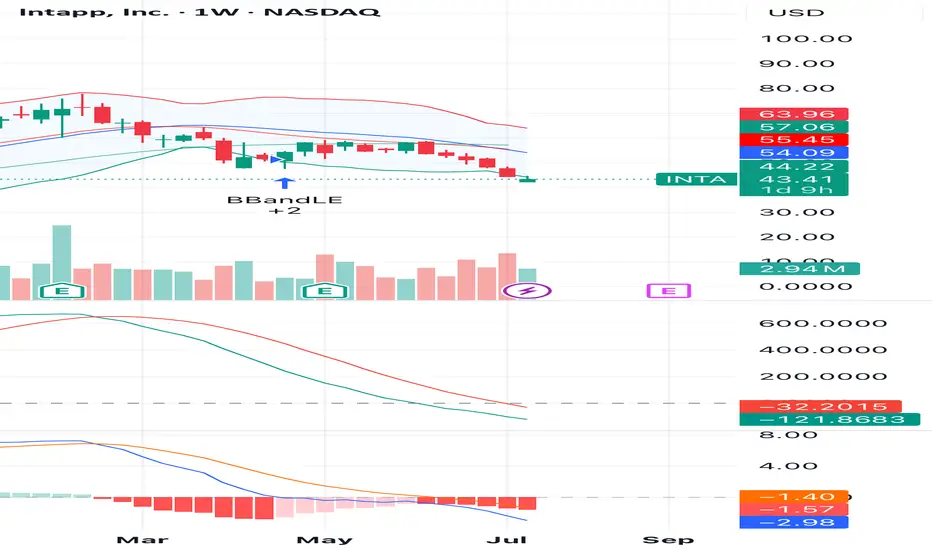
INTA is showing signs of a potential reversal after a consistent downtrend. On the weekly chart, the price touched the lower Bollinger Band with increased buying volume and a bullish candle forming. This may signal the end of the selling pressure.
Momentum indicators such as MACD and KST are flattening, suggesting a possible shift in momentum. A break above $44.22 could confirm a short-term bounce.
📈 Entry Zone: $43.00 – $44.50
🎯 Target 1: $54.00
🎯 Target 2: $57.00
🛑 Stop Loss: Below $41.00
This idea is based on technical signals; monitor volume and market conditions closely.
Aviso legal
As informações e publicações não devem ser e não constituem conselhos ou recomendações financeiras, de investimento, de negociação ou de qualquer outro tipo, fornecidas ou endossadas pela TradingView. Leia mais em Termos de uso.
Aviso legal
As informações e publicações não devem ser e não constituem conselhos ou recomendações financeiras, de investimento, de negociação ou de qualquer outro tipo, fornecidas ou endossadas pela TradingView. Leia mais em Termos de uso.