Key Technical Indicators:
Oscillators: Neutral
Moving Averages: Strong Buy
Overall Technical Rating: Neutral
Support and Resistance Levels:
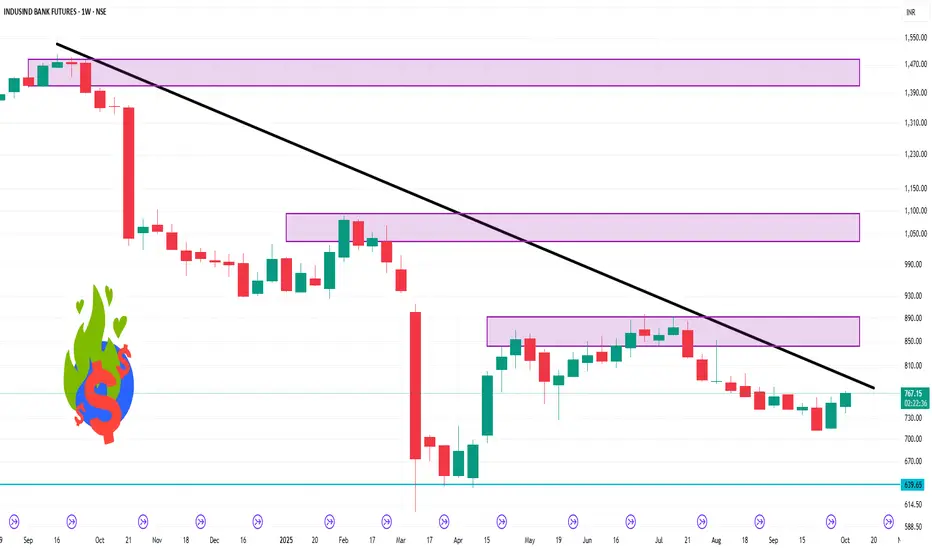
Weekly Pivot Points:
Support: 739.63
Resistance: 766.72
Additional Insights:
Relative Strength Index (RSI): The 14-day RSI is at 70.368, suggesting the stock is approaching overbought conditions, which may indicate a potential pullback
Moving Averages: The 5-day moving average is 755.54, and the 50-day moving average is 744.63, both indicating a bullish trend
Conclusion:
While the overall technical rating is neutral, the price action above the weekly pivot point and the bullish moving averages suggest a potential for upward movement. However, the elevated RSI indicates caution, as the stock may be due for a correction. Traders should monitor these levels closely and consider the broader market conditions before making trading decisions.
Oscillators: Neutral
Moving Averages: Strong Buy
Overall Technical Rating: Neutral
Support and Resistance Levels:
Weekly Pivot Points:
Support: 739.63
Resistance: 766.72
Additional Insights:
Relative Strength Index (RSI): The 14-day RSI is at 70.368, suggesting the stock is approaching overbought conditions, which may indicate a potential pullback
Moving Averages: The 5-day moving average is 755.54, and the 50-day moving average is 744.63, both indicating a bullish trend
Conclusion:
While the overall technical rating is neutral, the price action above the weekly pivot point and the bullish moving averages suggest a potential for upward movement. However, the elevated RSI indicates caution, as the stock may be due for a correction. Traders should monitor these levels closely and consider the broader market conditions before making trading decisions.
Publicações relacionadas
Aviso legal
As informações e publicações não se destinam a ser, e não constituem, conselhos ou recomendações financeiras, de investimento, comerciais ou de outro tipo fornecidos ou endossados pela TradingView. Leia mais nos Termos de Uso.
Publicações relacionadas
Aviso legal
As informações e publicações não se destinam a ser, e não constituem, conselhos ou recomendações financeiras, de investimento, comerciais ou de outro tipo fornecidos ou endossados pela TradingView. Leia mais nos Termos de Uso.