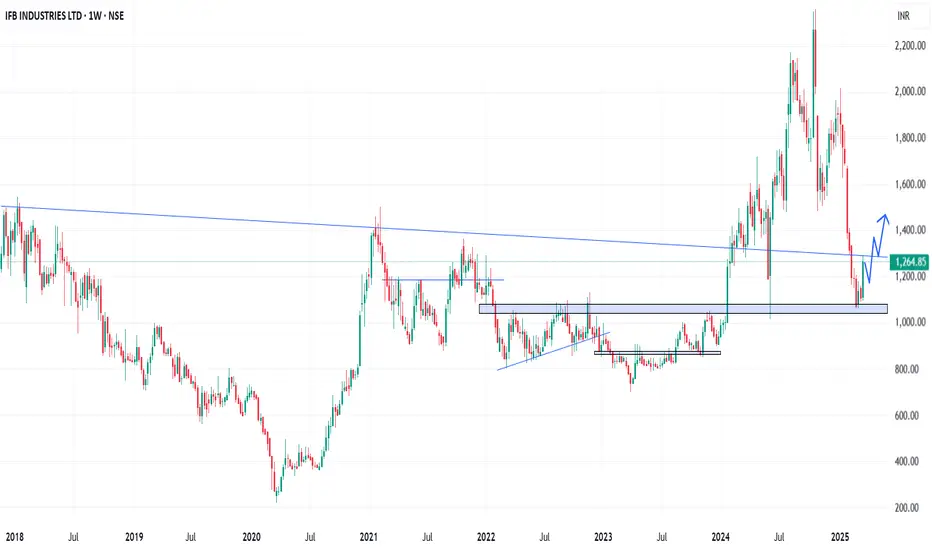
In the Weekly Chart of IFBIND ,
we can see that; it has given a bounce back from Support of 1080-1100 Trendline.
wait for a Halt or retrace candle and then enter with SL and Targets.
Expected momentum is shared in chart.
we can see that; it has given a bounce back from Support of 1080-1100 Trendline.
wait for a Halt or retrace candle and then enter with SL and Targets.
Expected momentum is shared in chart.
Aviso legal
As informações e publicações não devem ser e não constituem conselhos ou recomendações financeiras, de investimento, de negociação ou de qualquer outro tipo, fornecidas ou endossadas pela TradingView. Leia mais em Termos de uso.
Aviso legal
As informações e publicações não devem ser e não constituem conselhos ou recomendações financeiras, de investimento, de negociação ou de qualquer outro tipo, fornecidas ou endossadas pela TradingView. Leia mais em Termos de uso.