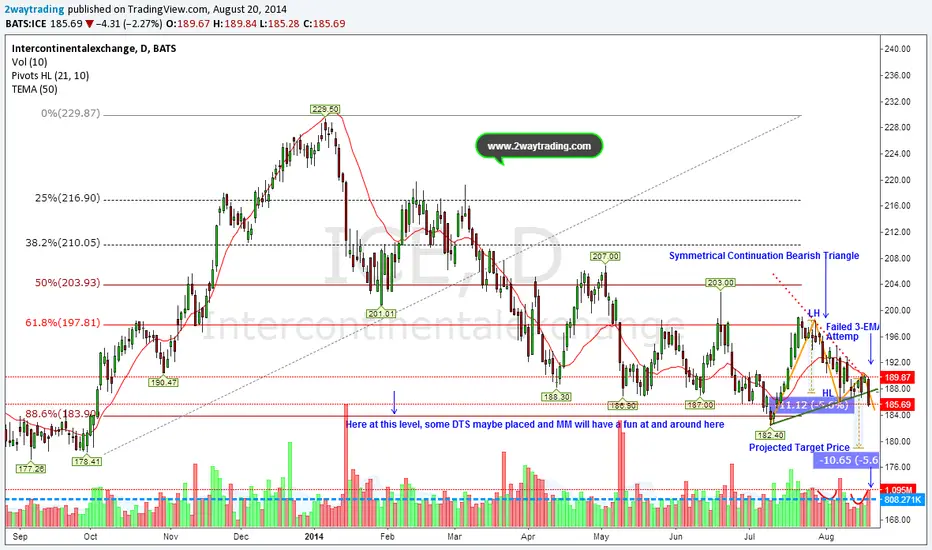
It looks the price has broken downward out of a consolidation period, suggesting a continuation of the June downtrend. A Symmetrical Continuation Triangle (Bearish) shows two converging trendlines as prices reach lower highs and higher lows. Volume diminishes as the price swings back and forth between an increasingly narrow range reflecting uncertainty in the market direction. Then well before the triangle reaches its apex, the price breaks down below the lower trendline with a noticeable increase in volume as shown the blue arrow on the last volume column, confirming the pattern as a continuation of the prior downtrend
Aviso legal
As informações e publicações não devem ser e não constituem conselhos ou recomendações financeiras, de investimento, de negociação ou de qualquer outro tipo, fornecidas ou endossadas pela TradingView. Leia mais em Termos de uso.
Aviso legal
As informações e publicações não devem ser e não constituem conselhos ou recomendações financeiras, de investimento, de negociação ou de qualquer outro tipo, fornecidas ou endossadas pela TradingView. Leia mais em Termos de uso.