This is a chart that I sent to my members today.
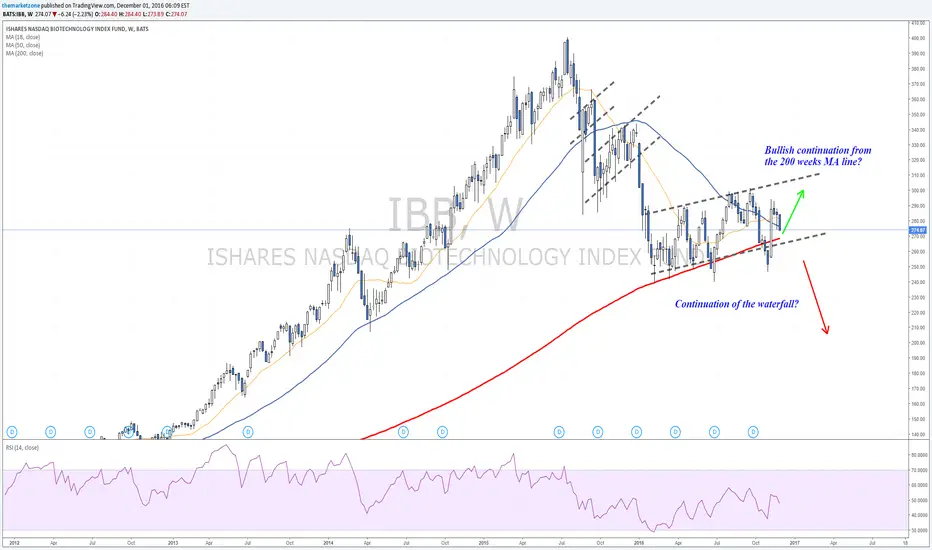
It presents two potential trades on IBB:
1. Bullish (short term) setup - 270$ is the key zone as it presents a weekly support zone.
2. Bearish continuation (based on longer term analysis) - Continuation of the the waterfall that started on May 2015.
Waiting to here your thoughts.
It presents two potential trades on IBB:
1. Bullish (short term) setup - 270$ is the key zone as it presents a weekly support zone.
2. Bearish continuation (based on longer term analysis) - Continuation of the the waterfall that started on May 2015.
Waiting to here your thoughts.
Nota
Despite Trump's comments, IBB holds the bottom of the channel. 270$ is nearest support.
Aviso legal
As informações e publicações não devem ser e não constituem conselhos ou recomendações financeiras, de investimento, de negociação ou de qualquer outro tipo, fornecidas ou endossadas pela TradingView. Leia mais em Termos de uso.
Aviso legal
As informações e publicações não devem ser e não constituem conselhos ou recomendações financeiras, de investimento, de negociação ou de qualquer outro tipo, fornecidas ou endossadas pela TradingView. Leia mais em Termos de uso.