Viés de alta
Sugestão da Casa
Cup and Handle Breakout Trade Setup on HIRECT (Daily Chart)
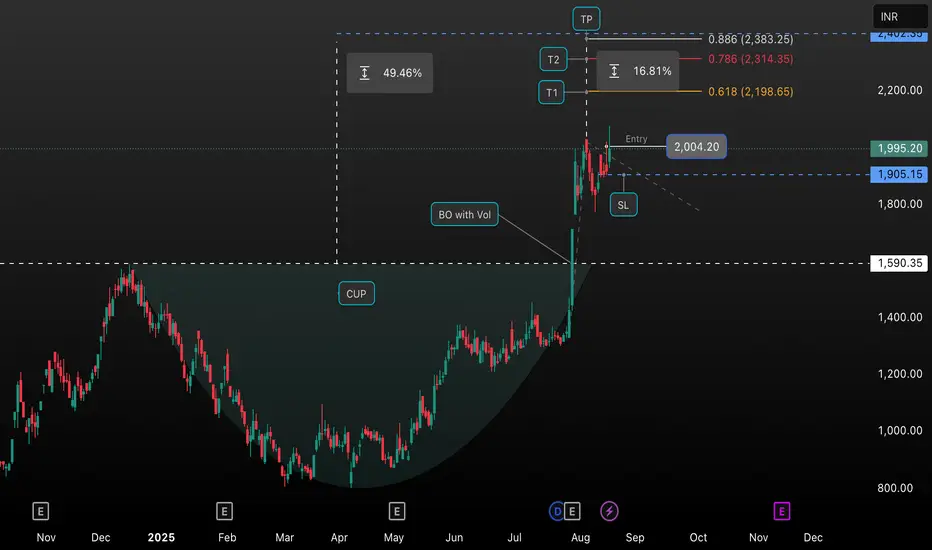
This chart illustrates a classic “Cup and Handle” breakout pattern on HIRECT, identified on the daily time frame. After forming a well-defined cup, the stock witnessed a significant breakout with increased volume (“BO with Vol”), signaling strong bullish momentum. Entry was triggered at ₹2,004.20, just above the handle resistance, with a suggested stop-loss (SL) below the breakout level at approximately ₹1,905.15.
The chart highlights multiple target zones (T1, T2, TP), based on Fibonacci extension levels and price action analysis:
• T1: 2,198.65 (61.8% Fibonacci extension)
• T2: 2,314.35 (78.6% extension)
• TP (Target Point): 2,383.25 (88.6% extension)
The setup indicates a potential upside move of about 49.46% from the cup base to the target point. To manage risk, the stop loss is set below breakout support. This setup is ideal for traders seeking a high-probability entry following a technical breakout pattern in a trending stock.
Aviso legal
As informações e publicações não devem ser e não constituem conselhos ou recomendações financeiras, de investimento, de negociação ou de qualquer outro tipo, fornecidas ou endossadas pela TradingView. Leia mais em Termos de uso.
Aviso legal
As informações e publicações não devem ser e não constituem conselhos ou recomendações financeiras, de investimento, de negociação ou de qualquer outro tipo, fornecidas ou endossadas pela TradingView. Leia mais em Termos de uso.