Here’s a detailed **technical summary and analysis** of the Hindustan Zinc Ltd. (HINDZINC) chart you shared:
---
### **Chart Pattern & Setup:**
✅ **Rectangular Consolidation / Range Breakout:**
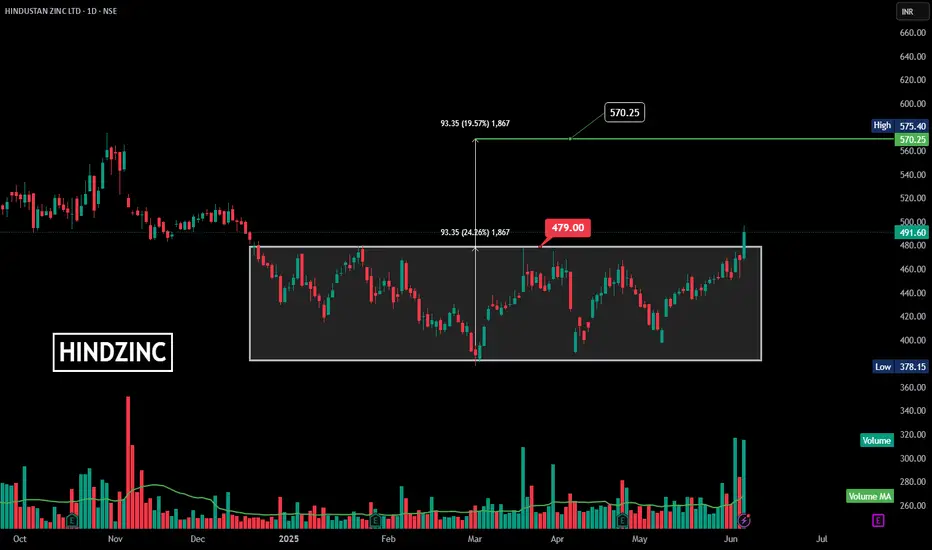
* The stock has been trading within a range (rectangle) from approximately **378.15 (low)** to **479.00 (resistance)** for several months (since December 2024).
* This consolidation pattern signifies **accumulation**.
✅ **Breakout:**
* Price action has decisively broken out of the **rectangle’s upper boundary at 479.00 INR**.
* **Current price:** 491.60 INR, showing bullish momentum.
---
### **Measured Move & Target:**
* The height of the range (rectangle) is **93.35 INR** (24.26% move).
* **Target Calculation:**
$\text{Breakout Level (479)} + \text{Height (93.35)} = \approx \textbf{570.25 INR}$.
* Immediate resistance level is around 570-575 INR.
---
### **Volume Analysis:**
✅ A **significant spike in volume** confirms the breakout, validating the buying interest.
✅ The **Volume MA line** is also trending up, showing sustained interest.
---
### **Key Levels:**
* **Resistance (Breakout level):** 479.00 INR
* **Target:** 570.25 INR
* **Current Price:** 491.60 INR
* **Immediate support:** 479.00 INR
* **Low support:** 378.15 INR
---
### **Conclusion & Trade Idea:**
This breakout from a **rectangle consolidation** is a strong bullish signal, especially with the volume confirmation. If the price sustains above 479 INR, the next likely target is **570-575 INR**.
---
Would you like me to:
✅ Create a YouTube video title and description with these details?
✅ Suggest a possible trading plan or risk management idea?
✅ Generate hashtags for maximum YouTube SEO visibility?
Let me know! 🚀✨
---
### **Chart Pattern & Setup:**
✅ **Rectangular Consolidation / Range Breakout:**
* The stock has been trading within a range (rectangle) from approximately **378.15 (low)** to **479.00 (resistance)** for several months (since December 2024).
* This consolidation pattern signifies **accumulation**.
✅ **Breakout:**
* Price action has decisively broken out of the **rectangle’s upper boundary at 479.00 INR**.
* **Current price:** 491.60 INR, showing bullish momentum.
---
### **Measured Move & Target:**
* The height of the range (rectangle) is **93.35 INR** (24.26% move).
* **Target Calculation:**
$\text{Breakout Level (479)} + \text{Height (93.35)} = \approx \textbf{570.25 INR}$.
* Immediate resistance level is around 570-575 INR.
---
### **Volume Analysis:**
✅ A **significant spike in volume** confirms the breakout, validating the buying interest.
✅ The **Volume MA line** is also trending up, showing sustained interest.
---
### **Key Levels:**
* **Resistance (Breakout level):** 479.00 INR
* **Target:** 570.25 INR
* **Current Price:** 491.60 INR
* **Immediate support:** 479.00 INR
* **Low support:** 378.15 INR
---
### **Conclusion & Trade Idea:**
This breakout from a **rectangle consolidation** is a strong bullish signal, especially with the volume confirmation. If the price sustains above 479 INR, the next likely target is **570-575 INR**.
---
Would you like me to:
✅ Create a YouTube video title and description with these details?
✅ Suggest a possible trading plan or risk management idea?
✅ Generate hashtags for maximum YouTube SEO visibility?
Let me know! 🚀✨
Aviso legal
As informações e publicações não se destinam a ser, e não constituem, conselhos ou recomendações financeiras, de investimento, comerciais ou de outro tipo fornecidos ou endossados pela TradingView. Leia mais nos Termos de Uso.
Aviso legal
As informações e publicações não se destinam a ser, e não constituem, conselhos ou recomendações financeiras, de investimento, comerciais ou de outro tipo fornecidos ou endossados pela TradingView. Leia mais nos Termos de Uso.