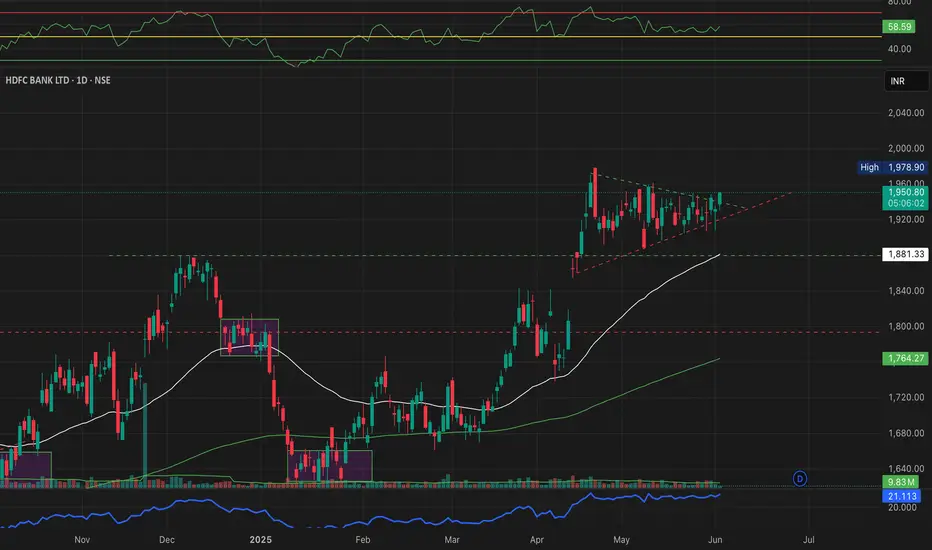
Symmetrical Triangle Tightening With Price Hovering Near Apex. Breakout Looks Imminent.
Price is also above 50 EMA, RSI around 56 - no extreme overbought zone, giving room for movement.
THIS LEVELS ARE PURELY BASED ON MANUAL PRICE ACTION - NO AUTO INDICATORS USED.
Will the triangle break upward or fakeout below? Let's Discuss in the comments!
All Levels hand - marked by Mayur Jayant Takalikar - based on clean structure & momentum zone spotting.
#HDFCBANK #PRICEACTION #TRADINGVIEWINDIA #CHARTANALYSIS #BREAKOUTSETUP #TRIANGLEPATTERN #SUPPORTRESISTANCE
Aviso legal
As informações e publicações não se destinam a ser, e não constituem, conselhos ou recomendações financeiras, de investimento, comerciais ou de outro tipo fornecidos ou endossados pela TradingView. Leia mais nos Termos de Uso.
Aviso legal
As informações e publicações não se destinam a ser, e não constituem, conselhos ou recomendações financeiras, de investimento, comerciais ou de outro tipo fornecidos ou endossados pela TradingView. Leia mais nos Termos de Uso.