📈 1-Month Performance Overview
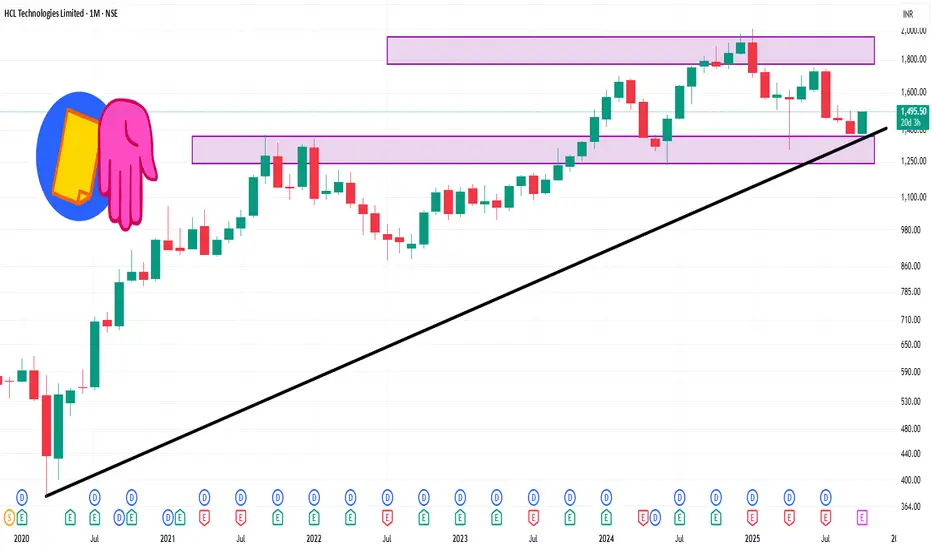
Current Price: ₹1,495.50
1-Month Change: +4.19%
52-Week Range: ₹1,302.75 – ₹2,012.20
Market Capitalization: ₹4,05,612 crore
P/E Ratio (TTM): 23.88
Dividend Yield: 4.02%
Over the past month, HCL Technologies has shown a steady upward trend, outperforming the Nifty IT Index, which has gained approximately 0.33% during the same period.
📊 Technical Snapshot
1-Month High: ₹1,502.90
1-Month Low: ₹1,380.40
Average Price: ₹1,443.09
Price Change: +2.16%
Publicações relacionadas
Aviso legal
As informações e publicações não devem ser e não constituem conselhos ou recomendações financeiras, de investimento, de negociação ou de qualquer outro tipo, fornecidas ou endossadas pela TradingView. Leia mais em Termos de uso.
Publicações relacionadas
Aviso legal
As informações e publicações não devem ser e não constituem conselhos ou recomendações financeiras, de investimento, de negociação ou de qualquer outro tipo, fornecidas ou endossadas pela TradingView. Leia mais em Termos de uso.