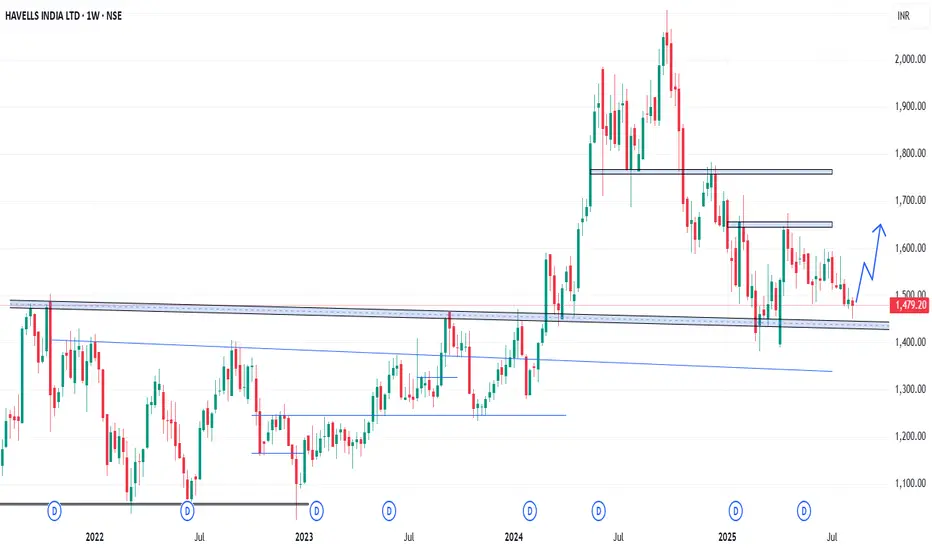
In the Weekly Chart of HAVELLS ,
we can see that, it has created a Hammer candle on support.
We can see a bounce back from here.
Expected momentum is shown in chart.
we can see that, it has created a Hammer candle on support.
We can see a bounce back from here.
Expected momentum is shown in chart.
Aviso legal
As informações e publicações não se destinam a ser, e não constituem, conselhos ou recomendações financeiras, de investimento, comerciais ou de outro tipo fornecidos ou endossados pela TradingView. Leia mais nos Termos de Uso.
Aviso legal
As informações e publicações não se destinam a ser, e não constituem, conselhos ou recomendações financeiras, de investimento, comerciais ou de outro tipo fornecidos ou endossados pela TradingView. Leia mais nos Termos de Uso.