Happiest Minds Technologies (HAPPSTMND) has recently exhibited a significant shift in market dynamics, marking a potential end to its prolonged downtrend that commenced in July 2024. In a recent trading session, the stock registered an impressive 11% gain in single trading session signaling a resurgence of buyer interest.
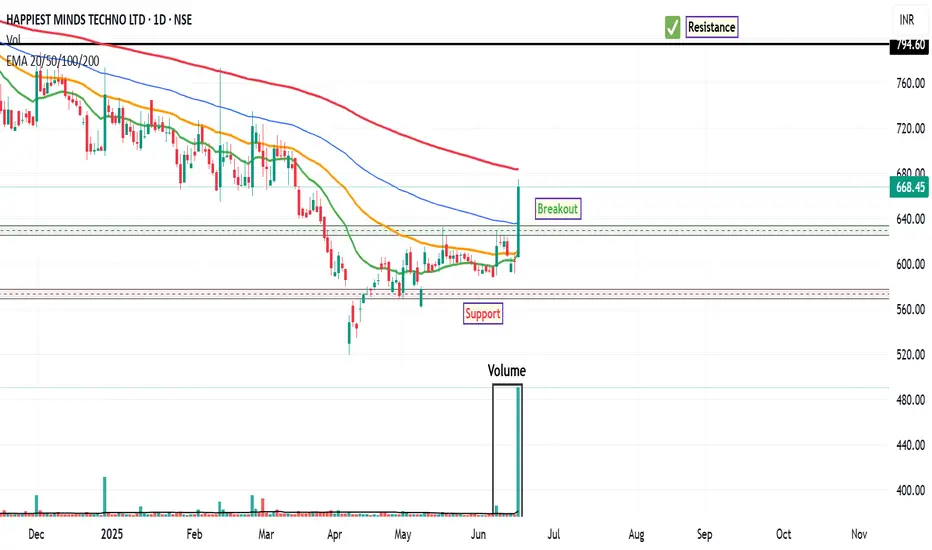
This notable price appreciation was accompanied by a substantial surge in trading volume, with approximately 25M shares changing hands. This volume figure represents nearly 15 times the 20 MA volume, indicating a robust influx of buying conviction and significant market participation behind the upward move. Such a volumetric anomaly often provides strong confirmation for price breakouts or reversals.
From a momentum perspective, the technical indicators are also aligning to support a more constructive outlook. The MACD indicator on the weekly timeframe executed a bullish crossover several weeks ago, a development that typically precedes or accompanies long-term upward trends. Furthermore, the RSI has now advanced to the 54 level. While not yet in overbought territory, this move above the 50-mark suggests increasing bullish momentum and a healthy strengthening of the trend. This confluence of weekly MACD signals and improving daily RSI readings points towards a potentially strong long-term bullish movement.
Considering these technical observations, the stock may face a significant long-term resistance level around ₹794. This level could present a crucial test for the prevailing bullish momentum, where a sustained breakout might pave the way for further upside. Conversely, for risk management purposes, traders may identify a suggested stop-loss zone and a breakout zone as illustrated on the accompanying chart, which would serve as key areas to monitor for potential shifts in price action or to define risk parameters.
Disclaimer: The information provided in this technical analysis is for informational and educational purposes only and should not be construed as financial advice. It is based on observations from historical price and volume data, and commonly used technical indicators. Market conditions can change rapidly, and past performance is not indicative of future results. All trading and investment decisions involve inherent risks, and losses can exceed initial investments. Always conduct your own comprehensive due diligence and consult with a qualified financial advisor before making any investment decisions.
Aviso legal
As informações e publicações não devem ser e não constituem conselhos ou recomendações financeiras, de investimento, de negociação ou de qualquer outro tipo, fornecidas ou endossadas pela TradingView. Leia mais em Termos de uso.
Aviso legal
As informações e publicações não devem ser e não constituem conselhos ou recomendações financeiras, de investimento, de negociação ou de qualquer outro tipo, fornecidas ou endossadas pela TradingView. Leia mais em Termos de uso.