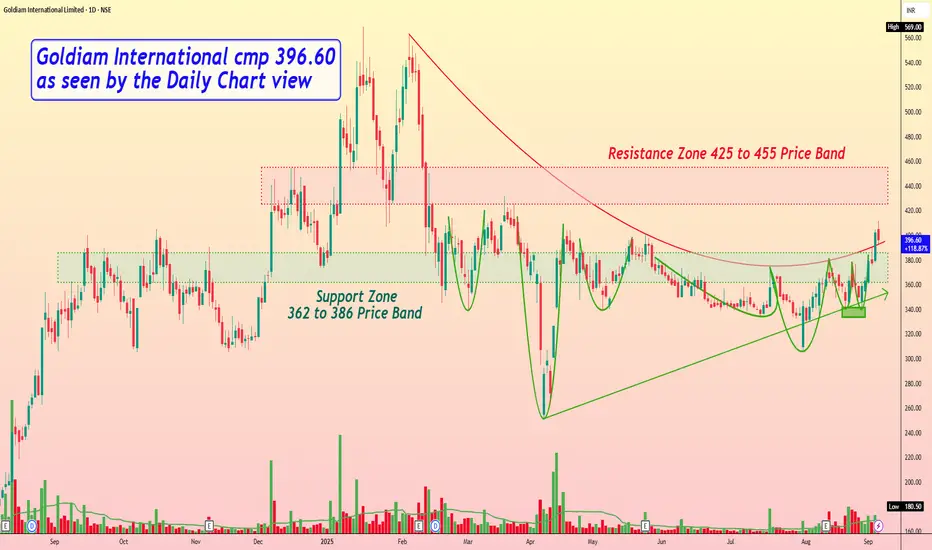
Goldiam International cmp 396.60 as seen by the Daily Chart view
- Support Zone 362 to 386 Price Band
- Resistance Zone 425 to 455 Price Band
- Bullish "W" with Double Bottom formed at 340 price level
- Breakout attempted from Curved Falling Resistance Trendline
- Price momentum has well respected the Rising Support Trendline
- Volumes spiking above avg traded quantity over the past few weeks
- Multiple Bullish Rounding Bottoms formed around Support Zone neckline
- Majority of common Technical Indicator BB, EMA, MACD, RSI trending positively
Aviso legal
As informações e publicações não se destinam a ser, e não constituem, conselhos ou recomendações financeiras, de investimento, comerciais ou de outro tipo fornecidos ou endossados pela TradingView. Leia mais nos Termos de Uso.
Aviso legal
As informações e publicações não se destinam a ser, e não constituem, conselhos ou recomendações financeiras, de investimento, comerciais ou de outro tipo fornecidos ou endossados pela TradingView. Leia mais nos Termos de Uso.