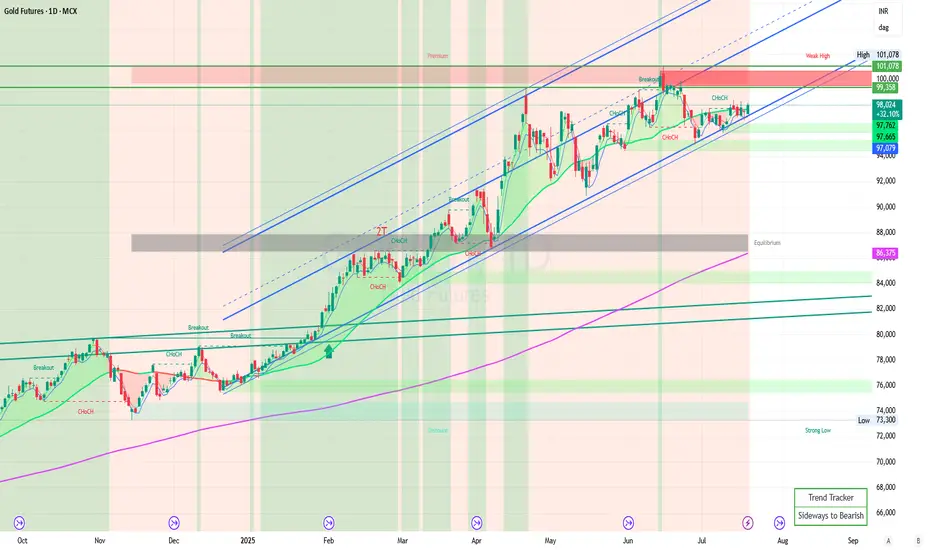
A gold daily time frame chart with an ascending channel is a technical analysis setup that shows the price movement of gold over a daily period, forming a pattern known as an ascending channel.
Key Features of an Ascending Channel:
- Trendline Connection: The channel is created by drawing two parallel trendlines:
- Lower Support Line: Connects the series of higher lows.
- Upper Resistance Line: Connects the series of higher highs.
- Price Action: The price of gold is moving upward within these two lines, bouncing between support and resistance.
- Trend Indication: Indicates a bullish trend, suggesting that the price is gradually increasing over time.
**Interpreting the Chart:
- Bullish Signal: As long as the price remains within the channel, the upward trend is considered intact.
- Trade Opportunities:
- Buy near support: When the price approaches the lower trendline.
- Sell near resistance: When the price nears the upper trendline.
- Breakouts:
- A move above the upper resistance line may signal strong bullish momentum.
- A break below the support line could indicate a trend reversal or correction.
Practical Use:
- Traders look for buying opportunities at the channel's support and be cautious if the price breaks out of the channel.
- Confirming other indicators or volume analysis can strengthen trading decisions.
Falgun Prajapati
Aviso legal
As informações e publicações não devem ser e não constituem conselhos ou recomendações financeiras, de investimento, de negociação ou de qualquer outro tipo, fornecidas ou endossadas pela TradingView. Leia mais em Termos de uso.
Falgun Prajapati
Aviso legal
As informações e publicações não devem ser e não constituem conselhos ou recomendações financeiras, de investimento, de negociação ou de qualquer outro tipo, fornecidas ou endossadas pela TradingView. Leia mais em Termos de uso.