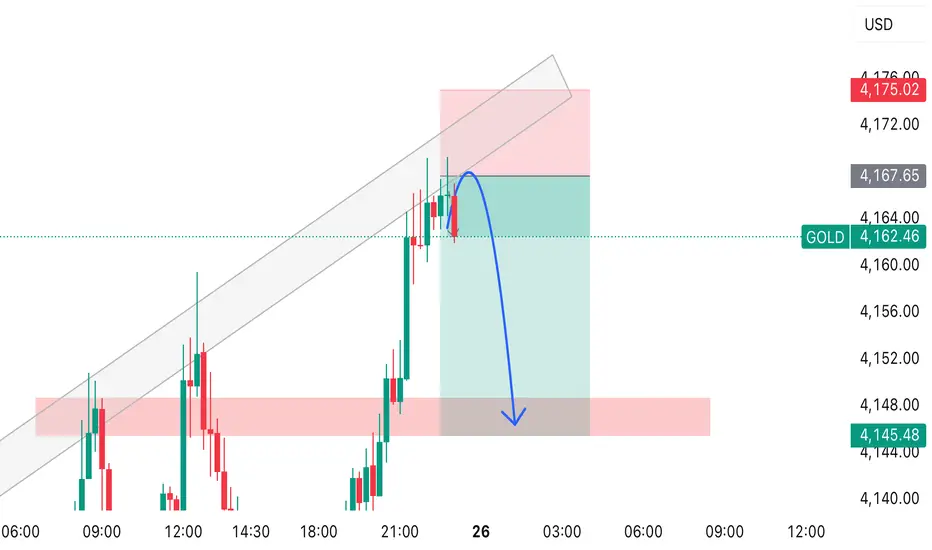
This TradingView chart shows GOLD price action approaching a resistance zone near 4167–4170 USD.
Price has been moving inside an ascending channel, shown with grey trendlines.
At the top of the channel, a rejection candle appears, and you’ve drawn a blue arrow indicating your expected move:
📉 Expected Move
• Price is expected to drop from the resistance zone.
• The arrow shows a move down towards the support demand zone near 4145–4150 USD (highlighted in red).
Trade ativo
Active Trade fechado: objetivo atingido
Target reached 🔥Aviso legal
As informações e publicações não se destinam a ser, e não constituem, conselhos ou recomendações financeiras, de investimento, comerciais ou de outro tipo fornecidos ou endossados pela TradingView. Leia mais nos Termos de Uso.
Aviso legal
As informações e publicações não se destinam a ser, e não constituem, conselhos ou recomendações financeiras, de investimento, comerciais ou de outro tipo fornecidos ou endossados pela TradingView. Leia mais nos Termos de Uso.